1928 United States presidential election in South Dakota
| ||||||||||||||||||||||||||
| ||||||||||||||||||||||||||
 County Results
| ||||||||||||||||||||||||||
| ||||||||||||||||||||||||||
| Elections in South Dakota |
|---|
 |
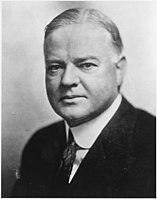
The 1928 United States presidential election in South Dakota took place on November 6, 1928, as part of the 1928 United States presidential election which was held throughout all contemporary 48 states. Voters chose five representatives, or electors to the Electoral College, who voted for president and vice president.
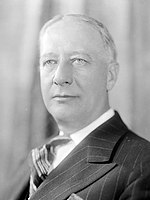
Ever since statehood South Dakota had been solidly Republican apart from when supporting Populist-backed William Jennings Bryan[1] by an exceedingly narrow 0.22% margin in 1896. However, the state had been one of the strongest for insurgent Robert M. La Follette senior in 1924, and after La Follette died six months following that election his family would endorse New York City Catholic Democrat Al Smith rather than any Republican.[2]
In the more Catholic states of North Dakota and Wisconsin, this endorsement would have a major effect in reviving a largely moribund Democratic Party at a presidential level, although it was not adequate to give Smith those states’ electoral votes.[3] In less Catholic and more Ozark-settled and Methodist South Dakota, anti-Catholicism was a powerful force in most areas and as a result Smith's gain on Davis’ vote was much less,[4] with the exception of a few powerfully pro-La Follette German Lutheran counties whose voters were lured by Smith's opposition to Prohibition.[5] Armstrong County, a sparsely-populated part of an Indian reservation, cast all 7 of its votes for Smith, setting a record for the nation.[6] Smith was the first ever Democrat to win McPherson County,[7] but South Dakota still voted for Republican nominee Herbert Hoover by a margin of 20.98%, which made it 3.56% more Republican than the nation at-large in a major landslide.
Results
[edit]| Presidential Candidate | Running Mate | Party | Electoral Vote (EV) | Popular Vote (PV) | |
|---|---|---|---|---|---|
| Herbert Hoover of California | Charles Curtis | Republican | 157,603 | 60.18% | 5[8] |
| Al Smith | Joseph T. Robinson | Democratic | 102,660 | 39.20% | 0 |
| Frank Webb | Will Vereen | Farm Labor | 927 | 0.35% | 0 |
| Norman Thomas | James Maurer | Socialist | 443 | 0.17% | 0 |
| William Z. Foster | Benjamin Gitlow | Workers | 232 | 0.09% | 0 |
Results by county
[edit]| County[9] | Herbert Clark Hoover Republican |
Alfred Emmanuel Smith Democratic |
Frank E. Webb Farm Labor |
Norman Mattoon Thomas Socialist |
William Z. Foster Workers |
Margin | Total votes cast | ||||||
|---|---|---|---|---|---|---|---|---|---|---|---|---|---|
| # | % | # | % | # | % | # | % | # | % | # | % | ||
| Armstrong | 0 | 0.00% | 7 | 100.00% | 0 | 0.00% | 0 | 0.00% | 0 | 0.00% | -7 | -100.00% | 7 |
| Aurora | 1,552 | 51.72% | 1,426 | 47.52% | 14 | 0.47% | 7 | 0.23% | 2 | 0.07% | 126 | 4.20% | 3,001 |
| Beadle | 5,094 | 61.43% | 3,168 | 38.20% | 17 | 0.20% | 12 | 0.14% | 2 | 0.02% | 1,926 | 23.22% | 8,293 |
| Bennett | 766 | 58.16% | 544 | 41.31% | 4 | 0.30% | 2 | 0.15% | 1 | 0.08% | 222 | 16.86% | 1,317 |
| Bon Homme | 2,262 | 50.93% | 2,166 | 48.77% | 6 | 0.14% | 7 | 0.16% | 0 | 0.00% | 96 | 2.16% | 4,441 |
| Brookings | 4,586 | 70.05% | 1,915 | 29.25% | 42 | 0.64% | 4 | 0.06% | 0 | 0.00% | 2,671 | 40.80% | 6,547 |
| Brown | 7,266 | 58.03% | 5,065 | 40.45% | 67 | 0.54% | 48 | 0.38% | 76 | 0.61% | 2,201 | 17.58% | 12,522 |
| Brule | 1,431 | 46.46% | 1,599 | 51.92% | 15 | 0.49% | 28 | 0.91% | 7 | 0.23% | -168 | -5.45% | 3,080 |
| Buffalo | 405 | 51.01% | 387 | 48.74% | 2 | 0.25% | 0 | 0.00% | 0 | 0.00% | 18 | 2.27% | 794 |
| Butte | 1,988 | 69.36% | 840 | 29.31% | 11 | 0.38% | 6 | 0.21% | 21 | 0.73% | 1,148 | 40.06% | 2,866 |
| Campbell | 1,346 | 69.13% | 588 | 30.20% | 8 | 0.41% | 4 | 0.21% | 1 | 0.05% | 758 | 38.93% | 1,947 |
| Charles Mix | 3,087 | 50.28% | 3,039 | 49.50% | 6 | 0.10% | 2 | 0.03% | 6 | 0.10% | 48 | 0.78% | 6,140 |
| Clark | 2,665 | 65.46% | 1,370 | 33.65% | 30 | 0.74% | 5 | 0.12% | 1 | 0.02% | 1,295 | 31.81% | 4,071 |
| Clay | 2,573 | 63.42% | 1,474 | 36.33% | 10 | 0.25% | 0 | 0.00% | 0 | 0.00% | 1,099 | 27.09% | 4,057 |
| Codington | 3,762 | 53.08% | 3,299 | 46.55% | 21 | 0.30% | 4 | 0.06% | 1 | 0.01% | 463 | 6.53% | 7,087 |
| Corson | 1,847 | 56.92% | 1,374 | 42.34% | 11 | 0.34% | 10 | 0.31% | 3 | 0.09% | 473 | 14.58% | 3,245 |
| Custer | 1,464 | 66.85% | 715 | 32.65% | 9 | 0.41% | 2 | 0.09% | 0 | 0.00% | 749 | 34.20% | 2,190 |
| Davison | 3,821 | 58.15% | 2,729 | 41.53% | 12 | 0.18% | 9 | 0.14% | 0 | 0.00% | 1,092 | 16.62% | 6,571 |
| Day | 3,180 | 54.22% | 2,642 | 45.05% | 28 | 0.48% | 11 | 0.19% | 4 | 0.07% | 538 | 9.17% | 5,865 |
| Deuel | 1,869 | 64.40% | 999 | 34.42% | 22 | 0.76% | 9 | 0.31% | 3 | 0.10% | 870 | 29.98% | 2,902 |
| Dewey | 1,293 | 56.39% | 996 | 43.44% | 2 | 0.09% | 2 | 0.09% | 0 | 0.00% | 297 | 12.95% | 2,293 |
| Douglas | 1,949 | 68.68% | 879 | 30.97% | 6 | 0.21% | 2 | 0.07% | 2 | 0.07% | 1,070 | 37.70% | 2,838 |
| Edmunds | 1,743 | 51.95% | 1,597 | 47.60% | 7 | 0.21% | 5 | 0.15% | 3 | 0.09% | 146 | 4.35% | 3,355 |
| Fall River | 2,216 | 63.51% | 1,258 | 36.06% | 9 | 0.26% | 6 | 0.17% | 0 | 0.00% | 958 | 27.46% | 3,489 |
| Faulk | 1,907 | 62.46% | 1,135 | 37.18% | 3 | 0.10% | 6 | 0.20% | 2 | 0.07% | 772 | 25.29% | 3,053 |
| Grant | 2,508 | 59.49% | 1,656 | 39.28% | 29 | 0.69% | 17 | 0.40% | 6 | 0.14% | 852 | 20.21% | 4,216 |
| Gregory | 2,274 | 53.04% | 2,001 | 46.68% | 10 | 0.23% | 2 | 0.05% | 0 | 0.00% | 273 | 6.37% | 4,287 |
| Haakon | 1,255 | 64.33% | 663 | 33.98% | 25 | 1.28% | 6 | 0.31% | 2 | 0.10% | 592 | 30.34% | 1,951 |
| Hamlin | 1,959 | 63.19% | 1,088 | 35.10% | 34 | 1.10% | 5 | 0.16% | 14 | 0.45% | 871 | 28.10% | 3,100 |
| Hand | 2,430 | 63.26% | 1,397 | 36.37% | 7 | 0.18% | 7 | 0.18% | 0 | 0.00% | 1,033 | 26.89% | 3,841 |
| Hanson | 1,576 | 58.13% | 1,129 | 41.65% | 3 | 0.11% | 3 | 0.11% | 0 | 0.00% | 447 | 16.49% | 2,711 |
| Harding | 1,032 | 72.78% | 368 | 25.95% | 12 | 0.85% | 3 | 0.21% | 3 | 0.21% | 664 | 46.83% | 1,418 |
| Hughes | 1,912 | 61.56% | 1,171 | 37.70% | 16 | 0.52% | 4 | 0.13% | 3 | 0.10% | 741 | 23.86% | 3,106 |
| Hutchinson | 2,145 | 52.61% | 1,898 | 46.55% | 26 | 0.64% | 2 | 0.05% | 6 | 0.15% | 247 | 6.06% | 4,077 |
| Hyde | 960 | 60.80% | 608 | 38.51% | 7 | 0.44% | 3 | 0.19% | 1 | 0.06% | 352 | 22.29% | 1,579 |
| Jackson | 704 | 62.63% | 417 | 37.10% | 2 | 0.18% | 1 | 0.09% | 0 | 0.00% | 287 | 25.53% | 1,124 |
| Jerauld | 1,517 | 62.69% | 875 | 36.16% | 15 | 0.62% | 13 | 0.54% | 0 | 0.00% | 642 | 26.53% | 2,420 |
| Jones | 857 | 66.43% | 422 | 32.71% | 5 | 0.39% | 5 | 0.39% | 1 | 0.08% | 435 | 33.72% | 1,290 |
| Kingsbury | 3,499 | 71.88% | 1,352 | 27.77% | 15 | 0.31% | 2 | 0.04% | 0 | 0.00% | 2,147 | 44.10% | 4,868 |
| Lake | 3,048 | 63.41% | 1,744 | 36.28% | 15 | 0.31% | 0 | 0.00% | 0 | 0.00% | 1,304 | 27.13% | 4,807 |
| Lawrence | 4,141 | 69.63% | 1,785 | 30.02% | 17 | 0.29% | 4 | 0.07% | 0 | 0.00% | 2,356 | 39.62% | 5,947 |
| Lincoln | 3,463 | 71.40% | 1,364 | 28.12% | 14 | 0.29% | 9 | 0.19% | 0 | 0.00% | 2,099 | 43.28% | 4,850 |
| Lyman | 1,488 | 54.75% | 1,222 | 44.96% | 5 | 0.18% | 3 | 0.11% | 0 | 0.00% | 266 | 9.79% | 2,718 |
| Marshall | 1,858 | 57.13% | 1,315 | 40.44% | 73 | 2.24% | 4 | 0.12% | 2 | 0.06% | 543 | 16.70% | 3,252 |
| McCook | 2,234 | 55.78% | 1,758 | 43.90% | 10 | 0.25% | 3 | 0.07% | 0 | 0.00% | 476 | 11.89% | 4,005 |
| McPherson | 1,234 | 45.52% | 1,468 | 54.15% | 6 | 0.22% | 2 | 0.07% | 1 | 0.04% | -234 | -8.63% | 2,711 |
| Meade | 2,845 | 66.04% | 1,441 | 33.45% | 11 | 0.26% | 10 | 0.23% | 1 | 0.02% | 1,404 | 32.59% | 4,308 |
| Mellette | 943 | 50.13% | 927 | 49.28% | 5 | 0.27% | 6 | 0.32% | 0 | 0.00% | 16 | 0.85% | 1,881 |
| Miner | 1,990 | 59.37% | 1,341 | 40.01% | 13 | 0.39% | 7 | 0.21% | 1 | 0.03% | 649 | 19.36% | 3,352 |
| Minnehaha | 13,741 | 66.68% | 6,805 | 33.02% | 35 | 0.17% | 20 | 0.10% | 7 | 0.03% | 6,936 | 33.66% | 20,608 |
| Moody | 2,108 | 59.63% | 1,416 | 40.06% | 5 | 0.14% | 4 | 0.11% | 2 | 0.06% | 692 | 19.58% | 3,535 |
| Pennington | 4,645 | 66.97% | 2,266 | 32.67% | 9 | 0.13% | 10 | 0.14% | 6 | 0.09% | 2,379 | 34.30% | 6,936 |
| Perkins | 2,262 | 68.57% | 1,010 | 30.62% | 12 | 0.36% | 11 | 0.33% | 4 | 0.12% | 1,252 | 37.95% | 3,299 |
| Potter | 1,240 | 52.77% | 1,100 | 46.81% | 6 | 0.26% | 2 | 0.09% | 2 | 0.09% | 140 | 5.96% | 2,350 |
| Roberts | 2,966 | 52.73% | 2,619 | 46.56% | 26 | 0.46% | 7 | 0.12% | 7 | 0.12% | 347 | 6.17% | 5,625 |
| Sanborn | 1,576 | 54.08% | 1,321 | 45.33% | 12 | 0.41% | 4 | 0.14% | 1 | 0.03% | 255 | 8.75% | 2,914 |
| Shannon | 469 | 43.63% | 601 | 55.91% | 2 | 0.19% | 3 | 0.28% | 0 | 0.00% | -132 | -12.28% | 1,075 |
| Spink | 3,868 | 60.89% | 2,451 | 38.59% | 16 | 0.25% | 14 | 0.22% | 3 | 0.05% | 1,417 | 22.31% | 6,352 |
| Stanley | 736 | 62.32% | 437 | 37.00% | 1 | 0.08% | 6 | 0.51% | 1 | 0.08% | 299 | 25.32% | 1,181 |
| Sully | 999 | 70.50% | 415 | 29.29% | 3 | 0.21% | 0 | 0.00% | 0 | 0.00% | 584 | 41.21% | 1,417 |
| Todd | 789 | 48.43% | 831 | 51.01% | 7 | 0.43% | 2 | 0.12% | 0 | 0.00% | -42 | -2.58% | 1,629 |
| Tripp | 2,396 | 53.02% | 2,099 | 46.45% | 10 | 0.22% | 14 | 0.31% | 0 | 0.00% | 297 | 6.57% | 4,519 |
| Turner | 3,362 | 70.65% | 1,380 | 29.00% | 10 | 0.21% | 5 | 0.11% | 2 | 0.04% | 1,982 | 41.65% | 4,759 |
| Union | 2,415 | 53.19% | 2,106 | 46.39% | 5 | 0.11% | 9 | 0.20% | 5 | 0.11% | 309 | 6.81% | 4,540 |
| Walworth | 1,854 | 59.96% | 1,216 | 39.33% | 15 | 0.49% | 5 | 0.16% | 2 | 0.06% | 638 | 20.63% | 3,092 |
| Washabaugh | 294 | 50.69% | 282 | 48.62% | 3 | 0.52% | 1 | 0.17% | 0 | 0.00% | 12 | 2.07% | 580 |
| Washington | 205 | 47.34% | 228 | 52.66% | 0 | 0.00% | 0 | 0.00% | 0 | 0.00% | -23 | -5.31% | 433 |
| Yankton | 2,971 | 50.88% | 2,841 | 48.66% | 14 | 0.24% | 9 | 0.15% | 4 | 0.07% | 130 | 2.23% | 5,839 |
| Ziebach | 759 | 55.00% | 615 | 44.57% | 2 | 0.14% | 3 | 0.22% | 1 | 0.07% | 144 | 10.43% | 1,380 |
| Totals | 157,603 | 60.19% | 102,660 | 39.20% | 927 | 0.35% | 443 | 0.17% | 224 | 0.09% | 54,943 | 20.98% | 261,857 |
See also
[edit]References
[edit]- ^ Phillips, Kevin P.; The Emerging Republican Majority, p. 418 ISBN 9780691163246
- ^ Menendez, Albert J.; The Geography of Presidential Elections in the United States, 1868-2004, p. 59 ISBN 0786422173
- ^ Phillips; The Emerging Republican Majority, pp. 420, 425
- ^ Phillips; The Emerging Republican Majority, p. 426
- ^ Okrent, David; Last Call: The Rise and Fall of Prohibition, p. 309 ISBN 9781464023255
- ^ "Armstrong County in South Dakota Voted Solidly for Al Smith". The Leader-Times. Vol. 40, no. 22. Kittaning, Pennsylvania. November 26, 1928. p. 1. Retrieved March 10, 2023 – via Newspapers.com.
- ^ Menendez; The Geography of Presidential Elections in the United States, pp. 294-298
- ^ Dave Leip. "1928 Presidential General Election Results – South Dakota". Dave Leip’s U.S. Election Atlas.
- ^ Our Campaigns; SD US Presidential Election Race, November 06, 1928


