From Wikipedia, the free encyclopedia
The 1964 United States presidential election in South Dakota took place on November 3, 1964, as part of the 1964 United States presidential election. Voters chose four[2] representatives, or electors, to the Electoral College, who voted for president and vice president.
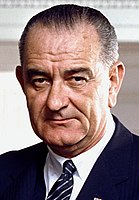
South Dakota was won by incumbent President Lyndon B. Johnson (D–Texas), with 55.61 percent of the popular vote, against Senator Barry Goldwater (R–Arizona), with 44.39% of the popular vote.[3][4] As of the 2020 presidential election[update], this is the last time South Dakota was carried by the Democratic nominee, as well as the last time a Democrat won Pennington County, Lincoln County, Meade County, Yankton County, Custer County, Bennett County, Clark County, Hamlin County, Hand County, Hyde County, Jackson County, Jones County, Lyman County, Mellette County, Potter County, Stanley County, Tripp County, and Walworth County.[5]
| County[6]
|
Lyndon B. Johnson
Democratic
|
Barry Goldwater
Republican
|
Margin
|
Total votes cast
|
| #
|
%
|
#
|
%
|
#
|
%
|
| Aurora
|
1,555
|
64.10%
|
871
|
35.90%
|
684
|
28.20%
|
2,426
|
| Beadle
|
5,968
|
59.57%
|
4,051
|
40.43%
|
1,917
|
19.14%
|
10,019
|
| Bennett
|
775
|
55.40%
|
624
|
44.60%
|
151
|
10.80%
|
1,399
|
| Bon Homme
|
2,494
|
58.30%
|
1,784
|
41.70%
|
710
|
16.60%
|
4,278
|
| Brookings
|
4,191
|
53.17%
|
3,692
|
46.83%
|
499
|
6.34%
|
7,883
|
| Brown
|
9,107
|
62.24%
|
5,524
|
37.76%
|
3,583
|
24.48%
|
14,631
|
| Brule
|
2,205
|
69.49%
|
968
|
30.51%
|
1,237
|
38.98%
|
3,173
|
| Buffalo
|
501
|
64.31%
|
278
|
35.69%
|
223
|
28.62%
|
779
|
| Butte
|
1,863
|
49.81%
|
1,877
|
50.19%
|
−14
|
−0.38%
|
3,740
|
| Campbell
|
411
|
26.13%
|
1,162
|
73.87%
|
−751
|
−47.74%
|
1,573
|
| Charles Mix
|
3,488
|
68.22%
|
1,625
|
31.78%
|
1,863
|
36.44%
|
5,113
|
| Clark
|
1,771
|
53.96%
|
1,511
|
46.04%
|
260
|
7.92%
|
3,282
|
| Clay
|
2,599
|
59.05%
|
1,802
|
40.95%
|
797
|
18.10%
|
4,401
|
| Codington
|
5,353
|
59.84%
|
3,593
|
40.16%
|
1,760
|
19.68%
|
8,946
|
| Corson
|
1,328
|
56.22%
|
1,034
|
43.78%
|
294
|
12.44%
|
2,362
|
| Custer
|
1,176
|
50.73%
|
1,142
|
49.27%
|
34
|
1.46%
|
2,318
|
| Davison
|
4,861
|
63.54%
|
2,789
|
36.46%
|
2,072
|
27.08%
|
7,650
|
| Day
|
3,235
|
62.83%
|
1,914
|
37.17%
|
1,321
|
25.66%
|
5,149
|
| Deuel
|
1,524
|
53.64%
|
1,317
|
46.36%
|
207
|
7.28%
|
2,841
|
| Dewey
|
1,259
|
56.21%
|
981
|
43.79%
|
278
|
12.42%
|
2,240
|
| Douglas
|
1,149
|
49.14%
|
1,189
|
50.86%
|
−40
|
−1.72%
|
2,338
|
| Edmunds
|
1,708
|
54.22%
|
1,442
|
45.78%
|
266
|
8.44%
|
3,150
|
| Fall River
|
1,706
|
45.71%
|
2,026
|
54.29%
|
−320
|
−8.58%
|
3,732
|
| Faulk
|
1,225
|
55.71%
|
974
|
44.29%
|
251
|
11.42%
|
2,199
|
| Grant
|
2,583
|
58.22%
|
1,854
|
41.78%
|
729
|
16.44%
|
4,437
|
| Gregory
|
1,995
|
54.82%
|
1,644
|
45.18%
|
351
|
9.64%
|
3,639
|
| Haakon
|
662
|
45.44%
|
795
|
54.56%
|
−133
|
−9.12%
|
1,457
|
| Hamlin
|
1,561
|
50.58%
|
1,525
|
49.42%
|
36
|
1.16%
|
3,086
|
| Hand
|
1,563
|
51.60%
|
1,466
|
48.40%
|
97
|
3.20%
|
3,029
|
| Hanson
|
1,232
|
60.57%
|
802
|
39.43%
|
430
|
21.14%
|
2,034
|
| Harding
|
487
|
49.90%
|
489
|
50.10%
|
−2
|
−0.20%
|
976
|
| Hughes
|
2,606
|
48.82%
|
2,732
|
51.18%
|
−126
|
−2.36%
|
5,338
|
| Hutchinson
|
2,189
|
43.15%
|
2,884
|
56.85%
|
−695
|
−13.70%
|
5,073
|
| Hyde
|
736
|
52.50%
|
666
|
47.50%
|
70
|
5.00%
|
1,402
|
| Jackson
|
480
|
51.72%
|
448
|
48.28%
|
32
|
3.44%
|
928
|
| Jerauld
|
999
|
53.83%
|
857
|
46.17%
|
142
|
7.66%
|
1,856
|
| Jones
|
548
|
56.91%
|
415
|
43.09%
|
133
|
13.82%
|
963
|
| Kingsbury
|
2,005
|
48.54%
|
2,126
|
51.46%
|
−121
|
−2.92%
|
4,131
|
| Lake
|
2,988
|
55.28%
|
2,417
|
44.72%
|
571
|
10.56%
|
5,405
|
| Lawrence
|
3,468
|
48.09%
|
3,743
|
51.91%
|
−275
|
−3.82%
|
7,211
|
| Lincoln
|
2,836
|
50.86%
|
2,740
|
49.14%
|
96
|
1.72%
|
5,576
|
| Lyman
|
1,057
|
55.08%
|
862
|
44.92%
|
195
|
10.16%
|
1,919
|
| Marshall
|
2,063
|
63.56%
|
1,183
|
36.44%
|
880
|
27.12%
|
3,246
|
| McCook
|
2,181
|
55.40%
|
1,756
|
44.60%
|
425
|
10.80%
|
3,937
|
| McPherson
|
723
|
27.66%
|
1,891
|
72.34%
|
−1,168
|
−44.68%
|
2,614
|
| Meade
|
2,323
|
52.05%
|
2,140
|
47.95%
|
183
|
4.10%
|
4,463
|
| Mellette
|
658
|
55.62%
|
525
|
44.38%
|
133
|
11.24%
|
1,183
|
| Miner
|
1,679
|
63.99%
|
945
|
36.01%
|
734
|
27.98%
|
2,624
|
| Minnehaha
|
20,929
|
55.52%
|
16,766
|
44.48%
|
4,163
|
11.04%
|
37,695
|
| Moody
|
2,301
|
61.16%
|
1,461
|
38.84%
|
840
|
22.32%
|
3,762
|
| Pennington
|
9,881
|
52.54%
|
8,926
|
47.46%
|
955
|
5.08%
|
18,807
|
| Perkins
|
1,255
|
47.11%
|
1,409
|
52.89%
|
−154
|
−5.78%
|
2,664
|
| Potter
|
1,260
|
56.91%
|
954
|
43.09%
|
306
|
13.82%
|
2,214
|
| Roberts
|
3,567
|
64.88%
|
1,931
|
35.12%
|
1,636
|
29.76%
|
5,498
|
| Sanborn
|
1,401
|
60.57%
|
912
|
39.43%
|
489
|
21.14%
|
2,313
|
| Shannon
|
1,748
|
75.84%
|
557
|
24.16%
|
1,191
|
51.68%
|
2,305
|
| Spink
|
3,120
|
61.50%
|
1,953
|
38.50%
|
1,167
|
23.00%
|
5,073
|
| Stanley
|
750
|
57.74%
|
549
|
42.26%
|
201
|
15.48%
|
1,299
|
| Sully
|
596
|
47.19%
|
667
|
52.81%
|
−71
|
−5.62%
|
1,263
|
| Todd
|
1,274
|
63.80%
|
723
|
36.20%
|
551
|
27.60%
|
1,997
|
| Tripp
|
2,241
|
53.64%
|
1,937
|
46.36%
|
304
|
7.28%
|
4,178
|
| Turner
|
2,184
|
43.42%
|
2,846
|
56.58%
|
−662
|
−13.16%
|
5,030
|
| Union
|
2,828
|
62.09%
|
1,727
|
37.91%
|
1,101
|
24.18%
|
4,555
|
| Walworth
|
1,952
|
51.35%
|
1,849
|
48.65%
|
103
|
2.70%
|
3,801
|
| Washabaugh
|
348
|
62.25%
|
211
|
37.75%
|
137
|
24.50%
|
559
|
| Yankton
|
3,747
|
53.87%
|
3,208
|
46.13%
|
539
|
7.74%
|
6,955
|
| Ziebach
|
554
|
55.34%
|
447
|
44.66%
|
107
|
10.68%
|
1,001
|
| Totals |
163,010 |
55.61% |
130,108 |
44.39% |
32,902 |
11.22% |
293,118
|
Counties that flipped from Republican to Democratic
[edit]


