1980 United States presidential election in Maryland
| |||||||||||||||||||||||||||||||||
| |||||||||||||||||||||||||||||||||
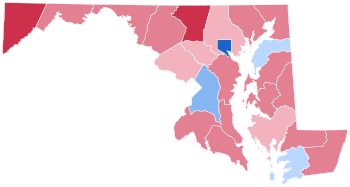
 County Results
| |||||||||||||||||||||||||||||||||
| |||||||||||||||||||||||||||||||||
| Elections in Maryland |
|---|
 |
|
|
The 1980 United States presidential election in Maryland took place on November 4, 1980, as part of the 1980 United States presidential election. Voters chose 10 representatives, or electors to the Electoral College, who voted for president and vice president.
Maryland was won by incumbent President Jimmy Carter (D-Georgia), with 47.12% of the popular vote, over former Governor Ronald Reagan (R-California) with 44.18% of the popular vote and Republican US Representative John B. Anderson running as an independent candidate (I-Illinois) with 7.76% of the popular vote.[1] Reagan ultimately won the national vote, defeating Carter; Maryland was one of only six states, along with the District of Columbia, to back the embattled incumbent.[2]
On election night, several news outlets incorrectly called the state for Reagan. In a similar vein, many of the same news outlets also called Massachusetts for President Carter, despite the fact that Reagan would ultimately end up narrowly winning Massachusetts.
In this election, Maryland voted 12.7% to the left of the nation at-large, or an 8.69 percent bigger differential than in 1976.[3] As of the 2020 presidential election, this is the last presidential election where the Democratic candidate won Maryland without carrying suburban Baltimore County, Howard County, or Montgomery County. This election marked the first time since 1908 in which Prince George’s County did not vote for the winner of the presidential election.[4] This is one of three elections between 1888 and 2000, that the state voted for the national loser (along with 1948 and 1968).
Results
[edit]| 1980 United States presidential election in Maryland[1] | |||||
|---|---|---|---|---|---|
| Party | Candidate | Votes | Percentage | Electoral votes | |
| Democratic | Jimmy Carter (Incumbent) | 726,161 | 47.12% | 10 | |
| Republican | Ronald Reagan | 680,606 | 44.18% | 0 | |
| Independent | John B. Anderson | 119,537 | 7.76% | 0 | |
| Libertarian | Ed Clark | 14,192 | 0.92% | 0 | |
| Totals | 1,540,496 | 100.0% | 10 | ||
Results by county
[edit]| County | Jimmy Carter Democratic |
Ronald Reagan Republican |
John B. Anderson Independent |
Ed Clark Libertarian |
Margin | Total votes cast | |||||
|---|---|---|---|---|---|---|---|---|---|---|---|
| # | % | # | % | # | % | # | % | # | % | ||
| Allegany | 12,167 | 38.65% | 17,512 | 55.62% | 1,486 | 4.72% | 319 | 1.01% | -5,345 | -16.97% | 31,484 |
| Anne Arundel | 50,780 | 38.58% | 69,443 | 52.76% | 10,020 | 7.61% | 1,389 | 1.06% | -18,663 | -14.18% | 131,632 |
| Baltimore | 121,280 | 43.33% | 132,490 | 47.33% | 23,096 | 8.25% | 3,051 | 1.09% | -11,210 | -4.00% | 279,917 |
| Baltimore City | 191,911 | 72.48% | 57,902 | 21.87% | 13,112 | 4.95% | 1,850 | 0.70% | 134,009 | 50.61% | 264,775 |
| Calvert | 4,745 | 43.65% | 5,440 | 50.05% | 590 | 5.43% | 95 | 0.87% | -695 | -6.40% | 10,870 |
| Caroline | 2,833 | 41.88% | 3,582 | 52.95% | 291 | 4.30% | 59 | 0.87% | -749 | -11.07% | 6,765 |
| Carroll | 10,393 | 31.55% | 19,859 | 60.29% | 2,243 | 6.81% | 445 | 1.35% | -9,466 | -28.74% | 32,940 |
| Cecil | 7,937 | 42.12% | 9,673 | 51.33% | 1,037 | 5.50% | 199 | 1.06% | -1,736 | -9.21% | 18,846 |
| Charles | 8,887 | 40.36% | 11,807 | 53.62% | 1,153 | 5.24% | 173 | 0.79% | -2,920 | -13.26% | 22,020 |
| Dorchester | 4,908 | 46.52% | 5,160 | 48.91% | 360 | 3.41% | 122 | 1.16% | -252 | -2.39% | 10,550 |
| Frederick | 13,629 | 34.83% | 22,033 | 56.31% | 2,891 | 7.39% | 577 | 1.47% | -8,404 | -21.48% | 39,130 |
| Garrett | 2,708 | 31.69% | 5,475 | 64.07% | 270 | 3.16% | 92 | 1.08% | -2,767 | -32.38% | 8,545 |
| Harford | 20,042 | 39.34% | 26,713 | 52.44% | 3,761 | 7.38% | 425 | 0.83% | -6,671 | -13.10% | 50,941 |
| Howard | 20,702 | 40.12% | 24,272 | 47.04% | 6,028 | 11.68% | 597 | 1.16% | -3,570 | -6.92% | 51,599 |
| Kent | 2,986 | 47.37% | 2,889 | 45.83% | 371 | 5.89% | 58 | 0.92% | 97 | 1.54% | 6,304 |
| Montgomery | 105,822 | 39.76% | 125,515 | 47.16% | 32,730 | 12.30% | 2,084 | 0.78% | -19,693 | -7.40% | 266,151 |
| Prince George's | 98,757 | 50.91% | 78,977 | 40.71% | 14,574 | 7.51% | 1,679 | 0.87% | 19,780 | 10.20% | 193,987 |
| Queen Anne's | 3,820 | 41.92% | 4,749 | 52.12% | 480 | 5.27% | 63 | 0.69% | -929 | -10.20% | 9,112 |
| Somerset | 3,342 | 48.18% | 3,312 | 47.74% | 215 | 3.10% | 68 | 0.98% | 30 | 0.44% | 6,937 |
| St. Mary's | 6,773 | 42.18% | 8,267 | 51.49% | 892 | 5.56% | 124 | 0.77% | -1,494 | -9.31% | 16,056 |
| Talbot | 3,995 | 37.30% | 6,044 | 56.43% | 570 | 5.32% | 102 | 0.95% | -2,049 | -19.13% | 10,711 |
| Washington | 14,118 | 36.12% | 22,901 | 58.60% | 1,689 | 4.32% | 375 | 0.96% | -8,783 | -22.48% | 39,083 |
| Wicomico | 9,431 | 43.05% | 11,229 | 51.26% | 1,092 | 4.99% | 153 | 0.70% | -1,798 | -8.21% | 21,905 |
| Worcester | 4,195 | 40.98% | 5,362 | 52.38% | 586 | 5.72% | 93 | 0.91% | -1,167 | -11.40% | 10,236 |
| Totals | 726,161 | 47.14% | 680,606 | 44.18% | 119,537 | 7.76% | 14,192 | 0.92% | 45,555 | 2.96% | 1,540,496 |
Counties that flipped from Democratic to Republican
[edit]See also
[edit]- United States presidential elections in Maryland
- 1980 United States presidential election
- 1980 United States elections
References
[edit]- ^ a b Maryland Manual 1981–1982. The Hall of Records Commission of the State of Maryland. p. 585. Retrieved May 12, 2019.
- ^ "1980 Presidential General Election Results". Dave Leip’s U.S. Election Atlas. Retrieved June 8, 2012.
- ^ "Dave Leip's Atlas of U.S. Presidential Elections". uselectionatlas.org. Retrieved March 31, 2023.
- ^ "Maryland - Google Drive". docs.google.com. Retrieved August 13, 2022.


