1912 United States presidential election in Wyoming
| |||||||||||||||||||||||||||||||||||||||||||||||||||||||
| |||||||||||||||||||||||||||||||||||||||||||||||||||||||
 County Results
| |||||||||||||||||||||||||||||||||||||||||||||||||||||||
| |||||||||||||||||||||||||||||||||||||||||||||||||||||||
| Elections in Wyoming |
|---|
 |
The 1912 United States presidential election in Wyoming took place on November 5, 1912, as part of the 1912 United States presidential election. State voters chose three representatives, or electors, to the Electoral College, who voted for president and vice president.
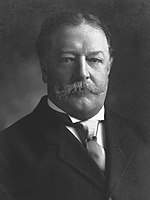
Wyoming was won by Princeton University President Woodrow Wilson (D–Virginia), running with governor of Indiana Thomas R. Marshall, with 36.20 percent of the popular vote, against the 27th president of the United States William Howard Taft (R–Ohio), running with Columbia University President Nicholas Murray Butler, with 34.42 percent of the popular vote, the 26th president of the United States Theodore Roosevelt (P–New York), running with governor of California Hiram Johnson, with 21.83 percent of the popular vote and the five-time candidate of the Socialist Party of America for President of the United States Eugene V. Debs (S–Indiana), running with the first Socialist mayor of a major city in the United States Emil Seidel, with 6.53 percent of the popular vote.[1]
Despite having a member of the Progressive Party (Joseph M. Carey) as the governor of the state, Theodore Roosevelt came in third and Wyoming was one of the areas Roosevelt received lower levels of support.
Results
[edit]| Party | Pledged to | Elector | Votes | |
|---|---|---|---|---|
| Democratic Party | Woodrow Wilson | Thomas M. Hyde | 15,310 | |
| Democratic Party | Woodrow Wilson | John Charles Thompson | 15,155 | |
| Democratic Party | Woodrow Wilson | Peter Kinney | 15,152 | |
| Republican Party | William Howard Taft | John E. Higgins | 14,560 | |
| Republican Party | William Howard Taft | Andrew Olson | 14,376 | |
| Republican Party | William Howard Taft | William B. Sleeper | 14,307 | |
| Progressive Party | Theodore Roosevelt | Thomas Blyth | 9,232 | |
| Progressive Party | Theodore Roosevelt | Helen B. Grant | 9,132 | |
| Progressive Party | Theodore Roosevelt | Robert R. Selway | 9,093 | |
| Socialist Party | Eugene V. Debs | Otto Humberger | 2,760 | |
| Socialist Party | Eugene V. Debs | Paul J. Paulson | 2,715 | |
| Socialist Party | Eugene V. Debs | John Suaja Jr. | 2,670 | |
| Prohibition Party | Eugene W. Chafin | William H. Clark | 434 | |
| Prohibition Party | Eugene W. Chafin | A. B. Campbell | 421 | |
| Prohibition Party | Eugene W. Chafin | A. F. Shultz | 403 | |
| Votes cast[a] | 42,296 | |||
Results by county
[edit]| County[2] | Woodrow Wilson Democrat |
William Howard Taft Republican |
Theodore Roosevelt Progressive "Bull Moose" |
Eugene V. Debs Socialist |
Eugene W. Chafin Prohibition |
Margin | Total votes cast[b] | ||||||
|---|---|---|---|---|---|---|---|---|---|---|---|---|---|
| # | % | # | % | # | % | # | % | # | % | # | % | ||
| Albany | 1,044 | 38.77% | 882 | 32.75% | 531 | 19.72% | 177 | 6.57% | 59 | 2.19% | 162 | 6.02% | 2,693 |
| Big Horn | 691 | 30.83% | 794 | 35.43% | 594 | 26.51% | 136 | 6.07% | 26 | 1.16% | -103 | -4.60% | 2,241 |
| Campbell | 361 | 48.78% | 186 | 25.14% | 163 | 22.03% | 19 | 2.57% | 11 | 1.49% | 175 | 23.64% | 740 |
| Carbon | 957 | 33.88% | 1,106 | 39.15% | 489 | 17.31% | 258 | 9.13% | 15 | 0.53% | -149 | -5.27% | 2,825 |
| Converse | 436 | 31.62% | 540 | 39.16% | 349 | 25.31% | 40 | 2.90% | 14 | 1.02% | -104 | -7.54% | 1,379 |
| Crook | 726 | 38.78% | 505 | 26.98% | 461 | 24.63% | 166 | 8.87% | 14 | 0.75% | 221 | 11.80% | 1,872 |
| Fremont | 993 | 40.45% | 811 | 33.03% | 511 | 20.81% | 131 | 5.34% | 9 | 0.37% | 182 | 7.42% | 2,455 |
| Goshen | 318 | 35.41% | 292 | 32.52% | 235 | 26.17% | 23 | 2.56% | 30 | 3.34% | 26 | 2.89% | 898 |
| Hot Springs | 343 | 34.10% | 273 | 27.14% | 298 | 29.62% | 80 | 7.95% | 12 | 1.19% | 45[c] | 4.48% | 1,006 |
| Johnson | 524 | 37.54% | 522 | 37.39% | 327 | 23.42% | 21 | 1.50% | 2 | 0.14% | 2 | 0.15% | 1,396 |
| Laramie | 1,923 | 40.03% | 1,871 | 38.95% | 835 | 17.38% | 131 | 2.73% | 44 | 0.92% | 52 | 1.08% | 4,804 |
| Lincoln | 1,028 | 30.43% | 1,430 | 42.33% | 580 | 17.17% | 334 | 9.89% | 6 | 0.18% | -402 | -11.90% | 3,378 |
| Natrona | 447 | 31.79% | 640 | 45.52% | 262 | 18.63% | 52 | 3.70% | 5 | 0.36% | -193 | -13.73% | 1,406 |
| Niobrara | 282 | 27.84% | 500 | 49.36% | 142 | 14.02% | 30 | 2.96% | 59 | 5.82% | -218 | -21.52% | 1,013 |
| Park | 672 | 37.50% | 534 | 29.80% | 470 | 26.23% | 88 | 4.91% | 28 | 1.56% | 138 | 7.70% | 1,792 |
| Platte | 785 | 44.48% | 500 | 28.33% | 353 | 20.00% | 87 | 4.93% | 40 | 2.27% | 285 | 16.15% | 1,765 |
| Sheridan | 1,649 | 38.82% | 862 | 20.29% | 1,305 | 30.72% | 398 | 9.37% | 34 | 0.80% | 344[c] | 8.10% | 4,248 |
| Sweetwater | 916 | 36.89% | 888 | 35.76% | 390 | 15.71% | 279 | 11.24% | 10 | 0.40% | 28 | 1.13% | 2,483 |
| Uinta | 535 | 27.84% | 717 | 37.30% | 463 | 24.09% | 207 | 10.77% | 0 | 0.00% | -182 | -9.46% | 1,922 |
| Washakie | 221 | 32.74% | 258 | 38.22% | 168 | 24.89% | 23 | 3.41% | 5 | 0.74% | -37 | -5.48% | 675 |
| Weston | 459 | 35.17% | 449 | 34.41% | 306 | 23.45% | 80 | 6.13% | 11 | 0.84% | 10 | 0.76% | 1,305 |
| Totals | 15,310 | 36.20% | 14,560 | 34.42% | 9,232 | 21.83% | 2,760 | 6.53% | 434 | 1.03% | 750 | 1.78% | 42,296 |
Counties that flipped from Republican to Democratic
[edit]See also
[edit]Notes
[edit]References
[edit]- ^ "1912 Presidential Election Results Wyoming".
- ^ a b Trenholm, Virginia Cole, ed. (1974). "Election Statistics". Wyoming Blue Book Volume II (PDF). Cheyenne, Wyoming: Wyoming State Archives and Historical Department. p. 580. Retrieved October 18, 2024.


