1912 United States presidential election in New Hampshire
| |||||||||||||||||||||||||||||||||
| |||||||||||||||||||||||||||||||||
 County Results
| |||||||||||||||||||||||||||||||||
| |||||||||||||||||||||||||||||||||
| Elections in New Hampshire |
|---|
 |
The 1912 United States presidential election in New Hampshire took place on November 5, 1912, as part of the 1912 United States presidential election which was held throughout all contemporary 48 states. Voters chose four representatives, or electors to the Electoral College, who voted for president and vice president.
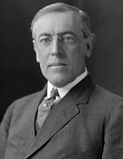
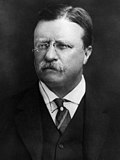
New Hampshire was won by the Democratic nominees, New Jersey Governor Woodrow Wilson and Indiana Governor Thomas R. Marshall. Wilson and Marshall defeated incumbent President William Howard Taft, and his running mate Vice President James S. Sherman and Progressive Party candidates, former President Theodore Roosevelt and his running mate California Governor Hiram Johnson.
Wilson won New Hampshire by a narrow margin of 2.05 points, becoming the first Democratic presidential candidate since New Hampshire native Franklin Pierce in 1852 to win the state or populous Hillsborough and Strafford Counties. He was the first Democrat since Grover Cleveland in 1892 to carry any of New Hampshire's counties, the first since Cleveland in 1888 to carry Merrimack and Rockingham Counties, the first to win Belknap County since Cleveland in 1884, and the first to win Grafton County since Winfield S. Hancock in 1880.[1]
Although Taft ended up losing the state, New Hampshire would prove to be his second strongest state with 37.43 percent of the vote after Utah (Taft's sole other win beside neighboring Vermont).[2]
This was the last time until 2008 that a Democratic presidential nominee would carry Carroll County. Belknap, Grafton, Merrimack and Rockingham Counties would not vote Democratic until 1964.[1]
Results
[edit]| 1912 United States presidential election in New Hampshire[3] | ||||||||
|---|---|---|---|---|---|---|---|---|
| Party | Candidate | Running mate | Popular vote | Electoral vote | ||||
| Count | % | Count | % | |||||
| Democratic | Woodrow Wilson of New Jersey | Thomas Riley Marshall of Indiana | 34,724 | 39.48% | 4 | 100.00% | ||
| Republican | William Howard Taft of Ohio (incumbent) | Nicholas Murray Butler of New York | 32,927 | 37.43% | 0 | 0.00% | ||
| Progressive | Theodore Roosevelt of New York | Hiram Warren Johnson of California | 17,794 | 20.23% | 0 | 0.00% | ||
| Socialist | Eugene Victor Debs of Indiana | Emil Seidel of Wisconsin | 1,981 | 2.25% | 0 | 0.00% | ||
| Prohibition | Eugene Wilder Chafin of Illinois | Aaron Sherman Watkins of Ohio | 535 | 0.61% | 0 | 0.00% | ||
| Total | 87,961 | 100.00% | 4 | 100.00% | ||||
Results by county
[edit]| County | Thomas Woodrow Wilson[4] Democratic |
William Howard Taft[4] Republican |
Theodore Roosevelt[4] Progressive "Bull Moose" |
Eugene Victor Debs[5] Socialist |
Eugene Wilder Chafin[5] Prohibition |
Margin | Total votes cast | ||||||
|---|---|---|---|---|---|---|---|---|---|---|---|---|---|
| # | % | # | % | # | % | # | % | # | % | # | % | ||
| Belknap | 1,862 | 39.38% | 1,741 | 36.82% | 944 | 19.97% | 103 | 2.18% | 78 | 1.65% | 121 | 2.56% | 4,728 |
| Carroll | 1,820 | 43.12% | 1,454 | 34.45% | 881 | 20.87% | 41 | 0.97% | 25 | 0.59% | 366 | 8.67% | 4,221 |
| Cheshire | 2,114 | 33.44% | 2,765 | 43.74% | 1,252 | 19.81% | 156 | 2.47% | 34 | 0.54% | -651 | -10.30% | 6,321 |
| Coös | 2,229 | 40.52% | 1,938 | 35.23% | 1,103 | 20.05% | 189 | 3.44% | 42 | 0.76% | 291 | 5.29% | 5,501 |
| Grafton | 3,752 | 39.12% | 3,520 | 36.70% | 2,165 | 22.58% | 93 | 0.97% | 60 | 0.63% | 232 | 2.42% | 9,590 |
| Hillsborough | 8,909 | 39.96% | 8,007 | 35.92% | 4,586 | 20.57% | 699 | 3.14% | 93 | 0.42% | 902 | 4.05% | 22,294 |
| Merrimack | 4,741 | 40.00% | 4,632 | 39.08% | 2,119 | 17.88% | 269 | 2.27% | 92 | 0.78% | 109 | 0.92% | 11,853 |
| Rockingham | 4,306 | 38.21% | 4,231 | 37.54% | 2,465 | 21.87% | 207 | 1.84% | 61 | 0.54% | 75 | 0.67% | 11,270 |
| Strafford | 3,468 | 44.09% | 2,962 | 37.66% | 1,265 | 16.08% | 140 | 1.95% | 31 | 0.39% | 506 | 6.43% | 7,866 |
| Sullivan | 1,523 | 35.28% | 1,677 | 38.85% | 1,014 | 23.49% | 84 | 1.95% | 19 | 0.44% | -154 | -3.57% | 4,317 |
| Totals | 34,724 | 39.48% | 32,927 | 37.43% | 17,794 | 20.23% | 1,981 | 2.25% | 535 | 0.61% | 1,797 | 2.04% | 87,961 |
See also
[edit]References
[edit]- ^ a b Menendez, Albert J. (2004). The Geography of Presidential Elections in the United States, 1868-2004. McFarland. p. 257. ISBN 0786422173.
- ^ "1912 Presidential Election Statistics". Dave Leip’s Atlas of U.S. Presidential Elections. Retrieved March 5, 2018.
- ^ "1912 Presidential General Election Results — New Hampshire". U.S. Election Atlas. Retrieved December 23, 2013.
- ^ a b c "1912 Presidential Election Popular Vote". Géoelections. (.xlsx file for €15)
- ^ a b "Presidential Election of 1912: Debs". Géoelections. (.xlsx file for €15)


