1976 United States presidential election in Massachusetts
| ||||||||||||||||||||||||||
| Turnout | 68.9%[1] | |||||||||||||||||||||||||
|---|---|---|---|---|---|---|---|---|---|---|---|---|---|---|---|---|---|---|---|---|---|---|---|---|---|---|
| ||||||||||||||||||||||||||
| ||||||||||||||||||||||||||
| ||||||||||||||||||||||||||
| Elections in Massachusetts |
|---|
 |
|
|
The 1976 United States presidential election in Massachusetts took place on November 2, 1976, as part of the 1976 United States presidential election, which was held throughout all 50 states and D.C. Voters chose 14 representatives, or electors to the Electoral College, who voted for president and vice president.
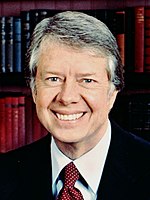
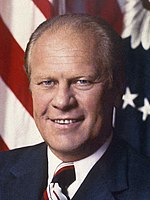
Massachusetts voted for the Democratic nominee, Georgia Governor Jimmy Carter, over incumbent Republican President Gerald Ford of Michigan. Carter's running mate was Senator Walter Mondale of Minnesota, while Ford ran with Senator Bob Dole of Kansas.
Carter carried Massachusetts with 56.11% of the vote to Ford's 40.44%, a 15.67% margin of victory. In a distant third was Independent candidate Eugene McCarthy, a former Democratic Senator from Minnesota known for his anti-war activism, who took 2.58%.
As Carter narrowly defeated Ford nationally to win the presidency, Massachusetts weighed in as 13% more Democratic than the national average in the 1976 election. Massachusetts had been a Democratic-leaning state since 1928, and a Democratic stronghold since 1960, so Carter's win was not unexpected. In 1972, Massachusetts was the only state in the nation to vote for Democrat George McGovern over Republican Richard Nixon in the latter's 49-state landslide. McGovern had carried Massachusetts 54–45, despite losing every other state in the midst of a massive Republican landslide.
Ford for his part performed relatively strongly in the state as a moderate Northern Republican, holding at just over 40% of the vote, while Carter gained only slightly over McGovern- even though Carter was winning nationally while McGovern was losing in a landslide. The state's capital and largest city, Boston, would be one of the few regions in the country where McGovern would actually perform more strongly than Carter in absolute terms. Suffolk County, where Boston is located, had voted for George McGovern in 1972 by a landslide of 66% versus Richard Nixon's 33%, but in 1976, Carter would only win the county with 61% versus Gerald Ford's 35%. Nevertheless, Dukes County, home to Martha's Vineyard, cast only its second-ever Democratic presidential vote, after 1964. This similarly occurred in Franklin County, and Plymouth cast only its third-ever Democratic victory. This is also the state with the most electoral votes that was decided by double digits.
In the 1960s, for three elections straight beginning with John F. Kennedy in 1960, Democrats had won landslides of over 60% of the vote, with Republicans failing to break 40%. Even in the GOP landslide of 1972, Massachusetts had clocked in as a whopping 32% more Democratic than the nation. Thus overall the results of 1976 indicated a slight Republican rebound in the state that would continue into the 1980s. To date, this is the last time that the towns of Chilmark and Conway voted Republican.
Results
[edit]| 1976 United States presidential election in Massachusetts[2] | |||||
|---|---|---|---|---|---|
| Party | Candidate | Votes | Percentage | Electoral votes | |
| Democratic | Jimmy Carter | 1,429,475 | 56.11% | 14 | |
| Republican | Gerald Ford (incumbent) | 1,030,276 | 40.44% | 0 | |
| Independent | Eugene McCarthy | 65,637 | 2.58% | 0 | |
| Socialist Workers | Peter Camejo | 8,138 | 0.32% | 0 | |
| American | Thomas J. Anderson | 7,555 | 0.30% | 0 | |
| U.S. Labor | Lyndon LaRouche | 4,922 | 0.19% | 0 | |
| Write-ins | Write-ins | 1,554 | 0.06% | 0 | |
| Totals | 2,547,557 | 100.00% | 14 | ||
| Voter Turnout (Voting age/Registered) | 62%/81% | ||||
Results by county
[edit]| County[3] | Jimmy Carter Democratic |
Gerald Ford Republican |
Various candidates Other parties |
Margin | Total votes cast | ||||
|---|---|---|---|---|---|---|---|---|---|
| # | % | # | % | # | % | # | % | ||
| Barnstable | 31,568 | 43.00% | 39,295 | 53.52% | 2,554 | 3.48% | -7,727 | -10.52% | 73,417 |
| Berkshire | 39,337 | 57.12% | 27,462 | 39.87% | 2,072 | 3.01% | 11,875 | 17.25% | 68,871 |
| Bristol | 116,318 | 60.66% | 69,957 | 36.48% | 5,494 | 2.86% | 46,361 | 24.18% | 191,769 |
| Dukes | 2,513 | 48.94% | 2,365 | 46.06% | 257 | 5.00% | 148 | 2.88% | 5,135 |
| Essex | 165,710 | 54.97% | 125,538 | 41.65% | 10,196 | 3.38% | 40,172 | 13.32% | 301,444 |
| Franklin | 14,985 | 48.06% | 14,837 | 47.58% | 1,359 | 4.36% | 148 | 0.48% | 31,181 |
| Hampden | 110,028 | 59.38% | 70,008 | 37.78% | 5,254 | 2.84% | 40,020 | 21.60% | 185,298 |
| Hampshire | 34,947 | 58.17% | 22,219 | 36.99% | 2,909 | 4.84% | 12,728 | 21.18% | 60,075 |
| Middlesex | 359,919 | 55.77% | 260,044 | 40.29% | 25,419 | 3.94% | 99,875 | 15.48% | 645,382 |
| Nantucket | 1,115 | 42.46% | 1,399 | 53.27% | 112 | 4.27% | -284 | -10.81% | 2,626 |
| Norfolk | 155,342 | 51.33% | 136,628 | 45.15% | 10,646 | 3.52% | 18,714 | 6.18% | 302,616 |
| Plymouth | 83,663 | 50.88% | 74,684 | 45.42% | 6,086 | 3.70% | 8,979 | 5.46% | 164,433 |
| Suffolk | 142,010 | 61.11% | 80,623 | 34.70% | 9,739 | 4.19% | 61,387 | 26.41% | 232,372 |
| Worcester | 172,320 | 60.41% | 105,217 | 36.89% | 7,707 | 2.70% | 67,103 | 23.52% | 285,244 |
| Totals | 1,429,475 | 56.11% | 1,030,276 | 40.44% | 87,806 | 3.45% | 399,199 | 15.67% | 2,547,558 |
Counties that flipped from Republican to Democratic
[edit]See also
[edit]References
[edit]- ^ REPORT NUMBER P20-322, Voting and Registration in the Election of November 1976, table 5
- ^ "1976 Presidential General Election Results - Massachusetts". Dave Leip's Atlas of U.S. Presidential Elections. Retrieved February 7, 2013.
- ^ "1976 President General Election". Secretary of the Commonwealth of Massachusetts - Elections Division: Elections Result Archive. Retrieved July 8, 2024.


