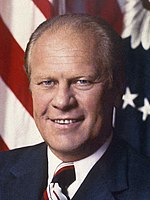
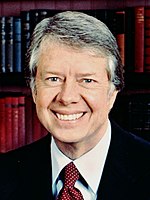
1976 United States presidential election in Oregon
| ||||||||||||||||||||||||||
| ||||||||||||||||||||||||||
 County Results
| ||||||||||||||||||||||||||
| ||||||||||||||||||||||||||
| Elections in Oregon |
|---|
 |
The 1976 United States presidential election in Oregon took place on November 2, 1976, as part of the 1976 United States presidential election. Voters chose six representatives, or electors, to the Electoral College, who voted for president and vice president.
Oregon was narrowly won by incumbent President Gerald Ford (R–Michigan) with 47.78% of the popular vote, against Jimmy Carter (D–Georgia), with 47.62% of the popular vote. Separated by a margin of 1,713 votes, this was the closest state in the 1976 presidential election.[1] This was also the closest presidential election in Oregon since its statehood in 1859. Oregon voted in this election at just over 2% more Republican than the nation-at-large.
None of the third-party candidates amounted to a significant portion of the vote, but Eugene McCarthy (I–Minnesota) won 3.90% of the popular vote and came third overall in the nation. Despite losing in Oregon, Carter went on to win the national election and became the 39th president of the United States.
As of 2020, this is the last occasion when Crook County, Wheeler County and Linn County have voted for a Democratic presidential candidate.[2] It was to end almost a century as a bellwether for Crook County, which was to become solidly Republican following the "Reagan Revolution".[3] Clackamas County, which supported Ford, would not vote for a losing presidential nominee again until 2016. This was also the last time in which a Democrat won the presidency without winning Oregon.
Results
[edit]| Party | Candidate | Votes | % | |
|---|---|---|---|---|
| Republican | Gerald Ford (inc.) | 492,120 | 47.78% | |
| Democratic | Jimmy Carter | 490,407 | 47.62% | |
| Independent | Eugene McCarthy | 40,207 | 3.90% | |
| Write-in[a] | 7,142 | 0.69% | ||
| Total votes | 1,029,876 | 100% | ||
Results by county
[edit]| County[5] | Gerald Ford Republican |
Jimmy Carter Democratic |
Eugene McCarthy Independent |
Various candidates[5] Write-ins |
Margin | Total votes cast | |||||
|---|---|---|---|---|---|---|---|---|---|---|---|
| # | % | # | % | # | % | # | % | # | % | ||
| Baker | 3,340 | 48.27% | 3,306 | 47.78% | 225 | 3.25% | 48 | 0.69% | 34 | 0.49% | 6,919 |
| Benton | 15,555 | 53.08% | 11,887 | 40.56% | 1,635 | 5.58% | 230 | 0.78% | 3,668 | 12.52% | 29,307 |
| Clackamas | 47,671 | 50.74% | 42,504 | 45.24% | 3,318 | 3.53% | 466 | 0.50% | 5,167 | 5.50% | 93,959 |
| Clatsop | 6,178 | 45.37% | 6,690 | 49.13% | 684 | 5.02% | 64 | 0.47% | -512 | -3.76% | 13,616 |
| Columbia | 5,226 | 37.71% | 8,005 | 57.76% | 521 | 3.76% | 107 | 0.77% | -2,779 | -20.05% | 13,859 |
| Coos | 9,481 | 38.35% | 14,168 | 57.30% | 924 | 3.74% | 152 | 0.61% | -4,687 | -18.95% | 24,725 |
| Crook | 2,093 | 43.81% | 2,536 | 53.09% | 102 | 2.14% | 46 | 0.96% | -443 | -9.28% | 4,777 |
| Curry | 2,962 | 45.52% | 3,227 | 49.59% | 294 | 4.52% | 24 | 0.37% | -265 | -4.07% | 6,507 |
| Deschutes | 9,054 | 46.71% | 9,480 | 48.91% | 729 | 3.76% | 119 | 0.61% | -426 | -2.20% | 19,382 |
| Douglas | 16,500 | 50.04% | 14,965 | 45.39% | 1,187 | 3.60% | 321 | 0.97% | 1,535 | 4.65% | 32,973 |
| Gilliam | 612 | 52.49% | 508 | 43.57% | 36 | 3.09% | 10 | 0.86% | 104 | 8.92% | 1,166 |
| Grant | 1,640 | 51.15% | 1,393 | 43.45% | 148 | 4.62% | 25 | 0.78% | 247 | 7.70% | 3,206 |
| Harney | 1,652 | 48.49% | 1,567 | 45.99% | 163 | 4.78% | 25 | 0.73% | 85 | 2.50% | 3,407 |
| Hood River | 3,210 | 48.37% | 3,114 | 46.93% | 287 | 4.32% | 25 | 0.38% | 96 | 1.44% | 6,636 |
| Jackson | 24,237 | 48.25% | 23,384 | 46.55% | 1,926 | 3.83% | 689 | 1.37% | 853 | 1.70% | 50,236 |
| Jefferson | 1,810 | 47.92% | 1,769 | 46.84% | 153 | 4.05% | 45 | 1.19% | 41 | 1.08% | 3,777 |
| Josephine | 10,726 | 50.81% | 9,061 | 42.92% | 899 | 4.26% | 424 | 2.01% | 1,665 | 7.89% | 21,110 |
| Klamath | 11,649 | 52.50% | 9,659 | 43.53% | 652 | 2.94% | 227 | 1.02% | 1,990 | 8.97% | 22,187 |
| Lake | 1,575 | 51.00% | 1,381 | 44.72% | 102 | 3.30% | 30 | 0.97% | 194 | 6.28% | 3,088 |
| Lane | 46,245 | 42.67% | 56,479 | 52.12% | 4,769 | 4.40% | 874 | 0.81% | -10,234 | -9.45% | 108,367 |
| Lincoln | 5,755 | 43.60% | 6,685 | 50.65% | 685 | 5.19% | 74 | 0.56% | -930 | -7.05% | 13,199 |
| Linn | 14,128 | 45.22% | 15,776 | 50.50% | 1,198 | 3.83% | 139 | 0.44% | -1,648 | -5.28% | 31,241 |
| Malheur | 5,682 | 59.13% | 3,507 | 36.49% | 368 | 3.83% | 53 | 0.55% | 2,175 | 22.64% | 9,610 |
| Marion | 35,497 | 49.08% | 33,781 | 46.70% | 2,678 | 3.70% | 375 | 0.52% | 1,716 | 2.38% | 72,331 |
| Morrow | 1,091 | 46.09% | 1,162 | 49.09% | 78 | 3.30% | 36 | 1.52% | -71 | -3.00% | 2,367 |
| Multnomah | 112,400 | 44.40% | 129,060 | 50.98% | 10,064 | 3.98% | 1,635 | 0.65% | -16,660 | -6.58% | 253,159 |
| Polk | 8,528 | 48.65% | 8,141 | 46.44% | 752 | 4.29% | 109 | 0.62% | 387 | 2.21% | 17,530 |
| Sherman | 567 | 51.13% | 491 | 44.27% | 48 | 4.33% | 3 | 0.27% | 76 | 6.86% | 1,109 |
| Tillamook | 4,033 | 45.48% | 4,456 | 50.25% | 337 | 3.80% | 41 | 0.46% | -423 | -4.77% | 8,867 |
| Umatilla | 9,345 | 51.83% | 7,985 | 44.28% | 599 | 3.33% | 102 | 0.57% | 1,360 | 7.55% | 18,031 |
| Union | 5,111 | 52.00% | 4,280 | 43.54% | 397 | 4.04% | 41 | 0.42% | 831 | 8.46% | 9,829 |
| Wallowa | 1,693 | 53.76% | 1,310 | 41.60% | 110 | 3.49% | 36 | 1.14% | 383 | 12.16% | 3,149 |
| Wasco | 4,258 | 46.08% | 4,560 | 49.35% | 350 | 3.79% | 72 | 0.78% | -302 | -3.27% | 9,240 |
| Washington | 52,376 | 57.80% | 34,847 | 38.46% | 2,999 | 3.31% | 389 | 0.43% | 17,529 | 19.34% | 90,611 |
| Wheeler | 355 | 45.57% | 402 | 51.60% | 17 | 2.18% | 5 | 0.64% | -47 | -6.03% | 779 |
| Yamhill | 9,885 | 50.38% | 8,881 | 45.27% | 773 | 3.94% | 81 | 0.41% | 1,004 | 5.11% | 19,620 |
| Totals | 492,120 | 47.78% | 490,407 | 47.62% | 40,207 | 3.90% | 7,142 | 0.69% | 1,713 | 0.16% | 1,029,876 |
Counties that flipped from Republican to Democratic
[edit]See also
[edit]Notes
[edit]- ^ Amongst these are 1,035 write-ins for national American Party candidate Thomas J. Anderson, which were not separated by county but given only as a statewide total.[5]
References
[edit]- ^ Dave Leip's Atlas of U.S Presidential Elections; 1976 Presidential Election Statistics
- ^ Sullivan, Robert David; ‘How the Red and Blue Map Evolved Over the Past Century’; America Magazine in The National Catholic Review; June 29, 2016
- ^ Lewis-Beck; Michael S.; 'Election Forecasts in 1984: How Accurate Were They'; Political Science and Politics 18(1) (January 1985), pp. 53-63
- ^ Dave Leip's Atlas of U.S Presidential Elections; 1976 Presidential General Election Results – Oregon
- ^ a b c Our Campaigns; OR US President, November 02, 1976


