2004 United States presidential election in Oregon
| ||||||||||||||||||||||||||
| Turnout | 68% | |||||||||||||||||||||||||
|---|---|---|---|---|---|---|---|---|---|---|---|---|---|---|---|---|---|---|---|---|---|---|---|---|---|---|
| ||||||||||||||||||||||||||
 County Results
| ||||||||||||||||||||||||||
| ||||||||||||||||||||||||||
| Elections in Oregon |
|---|
 |
The 2004 United States presidential election in Oregon took place on November 2, 2004, and was part of the 2004 United States presidential election. Voters chose seven representatives, or electors, to the Electoral College, who voted for president and vice president.
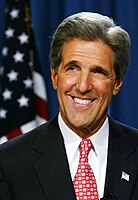
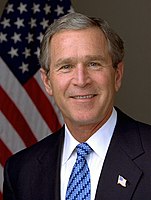
Oregon was won by Democratic nominee John Kerry by a 4.16 point margin of victory. Prior to the election, news organizations considered the state a tossup or leaning Kerry. A moderate amount of campaigning took place here, as Kerry won every poll after October 14, each with between 47% and 53% of the vote. Despite the state having been very competitive and being barely won by Al Gore four years earlier, Oregon is a consistent blue state that no Republican has won in a presidential election since Ronald Reagan in 1984. Kerry won this state with a modest margin, indicating Oregon's Democratic trend. This is the most recent presidential election in which Oregon was considered a swing state.[1]
As of the 2020 presidential election[update], this is the last election in which Clackamas County voted for a Republican presidential candidate as well as the final time the state's margin would be in the single digits,[2] and the last time a Republican received more than 45% of the state's vote. This election marked the first time in history that a Republican has been elected twice as president without ever carrying Oregon.
Primaries
[edit]Campaign
[edit]Predictions
[edit]There were 12 news organizations who made state-by-state predictions of the election. Here are their last predictions before election day.[3]
| Source | Ranking |
|---|---|
| D.C. Political Report | Lean D |
| Associated Press | Toss-up |
| CNN | Likely D |
| Cook Political Report | Lean D |
| Newsweek | Lean D |
| New York Times | Lean D |
| Rasmussen Reports | Likely D |
| Research 2000 | Solid D |
| Washington Post | Toss-up |
| Washington Times | Toss-up |
| Zogby International | Likely D |
| Washington Dispatch | Likely D |
Polling
[edit]Kerry won most pre-election polling. The final 3 poll average had Kerry leading 50% to 45% for Bush.[4]
Fundraising
[edit]Bush raised $1,497,451.[5] Kerry raised $1,937,916.[6]
Advertising and visits
[edit]In the week of September 28, both tickets combined spent an estimated $546,000 on advertising. However, both tickets spent less and less money each week.[7] Bush visited here 2 times. Kerry visited here 3 times. Both tickets visited the western part of the state.[8]
Analysis
[edit]After the 2000 election, which saw a particularly close race, Oregon was largely considered a potential Republican target. However, Democratic presidential candidate John Kerry won 51% of Oregon's vote, narrowly defeating Republican incumbent George W. Bush. The rural and highly conservative eastern interior and Southern Oregon favored Bush, but Kerry's strong support in the more urban Willamette Valley allowed him to win the state. About 68% of the voting age population came out to vote.
Results
[edit]| 2004 United States presidential election in Oregon | |||||
|---|---|---|---|---|---|
| Party | Candidate | Votes | Percentage | Electoral votes | |
| Democratic | John Kerry | 943,163 | 51.35% | 7 | |
| Republican | George W. Bush (incumbent) | 866,831 | 47.19% | 0 | |
| Write Ins | 8,956 | 0.49% | 0 | ||
| Libertarian | Michael Badnarik | 7,260 | 0.40% | 0 | |
| Pacific Green | David Cobb | 5,315 | 0.29% | 0 | |
| Constitution | Michael Peroutka | 5,257 | 0.29% | 0 | |
| Totals | 1,836,782 | 100.00% | 7 | ||
| Voter turnout (Voting age population) | 67.8% | ||||
Results by county
[edit]| County | John Kerry Democratic |
George W. Bush Republican |
Various candidates Other parties |
Margin | Total votes cast | ||||
|---|---|---|---|---|---|---|---|---|---|
| # | % | # | % | # | % | # | % | ||
| Baker | 2,616 | 28.96% | 6,253 | 69.22% | 165 | 1.83% | -3,637 | -40.26% | 9,034 |
| Benton | 26,515 | 57.98% | 18,460 | 40.36% | 760 | 1.67% | 8,055 | 17.62% | 45,735 |
| Clackamas | 95,129 | 48.78% | 97,691 | 50.10% | 2,180 | 1.12% | -2,562 | -1.32% | 195,000 |
| Clatsop | 10,461 | 54.18% | 8,503 | 44.04% | 345 | 1.79% | 1,958 | 10.14% | 19,309 |
| Columbia | 12,563 | 50.42% | 11,868 | 47.63% | 486 | 1.95% | 695 | 2.79% | 24,917 |
| Coos | 14,393 | 43.14% | 18,291 | 54.83% | 678 | 2.03% | -3,898 | -11.69% | 33,362 |
| Crook | 3,024 | 30.09% | 6,830 | 67.95% | 197 | 1.96% | -3,806 | -37.86% | 10,051 |
| Curry | 5,220 | 40.78% | 7,332 | 57.29% | 247 | 1.93% | -2,112 | -16.51% | 12,799 |
| Deschutes | 31,179 | 42.11% | 41,757 | 56.39% | 1,112 | 1.50% | -10,578 | -14.28% | 74,048 |
| Douglas | 18,089 | 32.90% | 35,956 | 65.39% | 939 | 1.71% | -17,867 | -32.49% | 54,984 |
| Gilliam | 370 | 32.51% | 755 | 66.34% | 13 | 1.14% | -385 | -33.83% | 1,138 |
| Grant | 780 | 19.21% | 3,204 | 78.90% | 77 | 1.90% | -2,424 | -59.69% | 4,061 |
| Harney | 839 | 22.66% | 2,815 | 76.04% | 48 | 1.30% | -1,976 | -53.38% | 3,702 |
| Hood River | 5,587 | 56.67% | 4,124 | 41.83% | 148 | 1.50% | 1,463 | 14.84% | 9,859 |
| Jackson | 44,366 | 43.42% | 56,519 | 55.31% | 1,304 | 1.28% | -12,153 | -11.89% | 102,189 |
| Jefferson | 3,243 | 39.96% | 4,762 | 58.68% | 110 | 1.36% | -1,519 | -18.72% | 8,115 |
| Josephine | 15,214 | 35.99% | 26,241 | 62.07% | 820 | 1.94% | -11,027 | -26.08% | 42,275 |
| Klamath | 8,264 | 26.22% | 22,733 | 72.13% | 518 | 1.64% | -14,469 | -45.91% | 31,515 |
| Lake | 802 | 20.54% | 3,039 | 77.82% | 64 | 1.64% | -2,237 | -57.28% | 3,905 |
| Lane | 107,769 | 57.98% | 75,007 | 40.35% | 3,096 | 1.67% | 32,762 | 17.63% | 185,872 |
| Lincoln | 13,753 | 56.54% | 10,160 | 41.77% | 412 | 1.69% | 3,593 | 14.77% | 24,325 |
| Linn | 19,940 | 38.32% | 31,260 | 60.07% | 841 | 1.62% | -11,320 | -21.75% | 52,041 |
| Malheur | 2,577 | 23.76% | 8,123 | 74.89% | 146 | 1.35% | -5,546 | -51.13% | 10,846 |
| Marion | 57,671 | 44.49% | 69,900 | 53.93% | 2,048 | 1.58% | -12,229 | -9.44% | 129,619 |
| Morrow | 1,361 | 32.80% | 2,732 | 65.85% | 56 | 1.35% | -1,371 | -33.05% | 4,149 |
| Multnomah | 259,585 | 71.57% | 98,439 | 27.14% | 4,670 | 1.29% | 161,146 | 44.43% | 362,694 |
| Polk | 15,484 | 43.63% | 19,508 | 54.97% | 497 | 1.40% | -4,024 | -11.34% | 35,489 |
| Sherman | 390 | 35.33% | 694 | 62.86% | 20 | 1.81% | -304 | -27.53% | 1,104 |
| Tillamook | 6,750 | 48.38% | 7,003 | 50.20% | 198 | 1.42% | -253 | -1.82% | 13,951 |
| Umatilla | 8,884 | 33.75% | 17,068 | 64.84% | 370 | 1.41% | -8,184 | -31.09% | 26,322 |
| Union | 4,428 | 32.75% | 8,879 | 65.68% | 212 | 1.57% | -4,451 | -32.93% | 13,519 |
| Wallowa | 1,269 | 28.07% | 3,132 | 69.28% | 120 | 2.65% | -1,863 | -41.21% | 4,521 |
| Wasco | 5,691 | 47.42% | 6,119 | 50.98% | 192 | 1.60% | -428 | -3.56% | 12,002 |
| Washington | 121,140 | 52.37% | 107,223 | 46.36% | 2,945 | 1.27% | 13,917 | 6.01% | 231,308 |
| Wheeler | 245 | 27.84% | 612 | 69.55% | 23 | 2.61% | -367 | -41.71% | 880 |
| Yamhill | 17,572 | 41.70% | 23,839 | 56.57% | 731 | 1.73% | -6,267 | -14.87% | 42,142 |
| Totals | 943,163 | 51.35% | 866,831 | 47.19% | 26,788 | 1.46% | 76,332 | 4.16% | 1,836,782 |
By congressional district
[edit]Kerry won 3 of 5 congressional districts. Bush won 2, including one held by a Democrat.[9]
| District | Kerry | Bush | Representative |
|---|---|---|---|
| 1st | 55% | 44% | David Wu |
| 2nd | 38% | 61% | Greg Walden |
| 3rd | 67% | 33% | Earl Blumenauer |
| 4th | 49% | 49% | Peter DeFazio |
| 5th | 49% | 50% | Darlene Hooley |
Electors
[edit]Technically the voters of Oregon cast their ballots for electors: representatives to the Electoral College. Oregon is allocated 7 electors because it has 5 congressional districts and 2 senators. All candidates who appear on the ballot or qualify to receive write-in votes must submit a list of 7 electors, who pledge to vote for their candidate and his or her running mate. Whoever wins the majority of votes in the state is awarded all 7 electoral votes. Their chosen electors then vote for president and vice president. Although electors are pledged to their candidate and running mate, they are not obligated to vote for them. An elector who votes for someone other than his or her candidate is known as a faithless elector.
The electors of each state and the District of Columbia met on December 13, 2004, to cast their votes for president and vice president. The Electoral College itself never meets as one body. Instead the electors from each state and the District of Columbia met in their respective capitols.
The following were the members of the Electoral College from the state. All seven were pledged for Kerry/Edwards.
- Michael J. Bohan
- Shirley A. Cairns
- James L. Edmunson
- Moshe D. Lenske
- Meredith Wood Smith
- Judy A. Sugnet
- Paul F. Zastrow
See also
[edit]References
[edit]- ^ Levien, Andrea (October 4, 2012). "How New Mexico Lost Its Swing". FairVote. Retrieved November 24, 2020.
- ^ Sullivan, Robert David; ‘How the Red and Blue Map Evolved Over the Past Century’; America Magazine in The National Catholic Review; June 29, 2016
- ^ http://www.dcpoliticalreport.com/members/2004/Pred2.htm#NW [permanent dead link]
- ^ "Election 2004 Polls - Dave Leip's Atlas of U.S. Presidential Elections".
- ^ "George W Bush - $374,659,453 raised, '04 election cycle, Republican Party, President". www.campaignmoney.com.
- ^ "John F Kerry - $345,826,176 raised, '04 election cycle, Democrat Party, President".
- ^ "CNN.com Specials". www.cnn.com.
- ^ "CNN.com Specials". www.cnn.com.
- ^ "Presidential Results by Congressional District, 2000-2008 – Swing State Project".


