From Wikipedia, the free encyclopedia
2014 European Parliament election in Belgium Turnout 89.64%[ 1]
First party
Second party
Third party
Leader
Johan Van Overtveldt
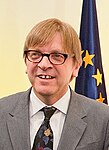
Guy Verhofstadt
Marie Arena
Party
N-VA
Open Vld
PS
Alliance
EFA
ALDE
PES
Last election
1 seat, 6.13%
3 seats, 12.25%
3 seats, 10.88%
Seats won
4
3
3
Seat change
Popular vote
1,123,363
859,254
714,784
Percentage
16.79%
12.84%
10.68%
Swing
Fourth party
Fifth party
Leader
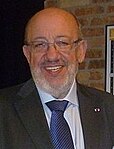
Louis Michel
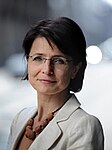
Marianne Thyssen
Party
MR
CD&V
Alliance
ALDE
EPP
Last election
2 seats, 9.74%
3 seats, 14.43%
Seats won
3
2
Seat change
Popular vote
661,408
840,814
Percentage
9.88%
12.56%
Swing
An election was held on 25 May 2014 in the three Belgian constituencies (the Dutch-speaking electoral college , the French-speaking electoral college and the German-speaking electoral college ) to elect the Belgian delegation to the European Parliament. This election, part of the 2014 European Parliament election , was held on the same day alongside the Belgian federal election and the Belgian regional elections .
21 Belgium MEPs were elected: 12 of them are Dutch-speaking, 8 of them are French-speaking and 1 of them is German-speaking. In the arrondissement of Brussels-Capital and six municipalities with language facilities , voters can choose whether to vote for the Dutch-speaking or for the French-speaking electoral college.
Opinion polling for the Dutch electoral college [ edit ]
Date
Polling Firm
CD&V VLD VB sp.a N-VA Groen PVDA Others
Lead
16 May
De Standaard
24.3
19.3
7.7
15.8
20.0
11.4
1.4
0.1
4.3
25 Apr
De Standaard
19.0
16.7
7.9
13.9
27.3
10.9
1.7
2.6
8.3
7 June 2009
European Elections 2009
23.3
20.6
15.9
13.2
9.9
7.9
1.0
8.3
2.7
Party Votes % Seats French-speaking electoral college Socialist Party 714,645 29.29 3 Reformist Movement 661,332 27.10 3 Ecolo 285,196 11.69 1 Humanist Democratic Centre 277,246 11.36 1 People's Party 145,909 5.98 0 Workers' Party of Belgium 133,811 5.48 0 Francophone Democratic Federalists 82,540 3.38 0 Debout Les Belges! 72,671 2.98 0 La Droite 38,813 1.59 0 Vega 15,208 0.62 0 Stand Up USE 7,970 0.33 0 MG 4,705 0.19 0 Total 2,440,046 100.00 8 Dutch-speaking electoral college New Flemish Alliance 1,123,355 26.67 4 Open Flemish Liberals and Democrats 859,099 20.40 3 Christian Democratic and Flemish 840,783 19.96 2 Socialist Party Differently 555,348 13.18 1 Green 447,391 10.62 1 Vlaams Belang 284,856 6.76 1 Workers' Party of Belgium 101,237 2.40 0 Total 4,212,069 100.00 12 German-speaking electoral college Christian Social Party 11,710 30.34 1 Ecolo 6,429 16.66 0 Partei für Freiheit und Fortschritt 6,197 16.06 0 Socialist Party 5,835 15.12 0 ProDG 5,106 13.23 0 Vivant 3,319 8.60 0 Total 38,596 100.00 1 Valid votes 6,690,711 93.90 Invalid/blank votes 434,450 6.10 Total votes 7,125,161 100.00 Registered voters/turnout 7,948,854 89.64 Source: Belgian Elections


