1988 United States presidential election in South Carolina
| ||||||||||||||||||||||||||
| ||||||||||||||||||||||||||
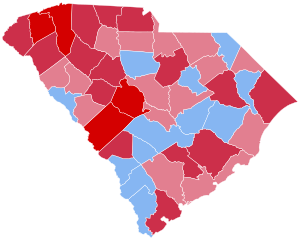
 County Results
| ||||||||||||||||||||||||||
| ||||||||||||||||||||||||||
| Elections in South Carolina |
|---|
 |
The 1988 United States presidential election in South Carolina took place on November 8, 1988. All 50 states and the District of Columbia, were part of the 1988 United States presidential election. South Carolina voters chose eight electors to the Electoral College, which selected the president and vice president.
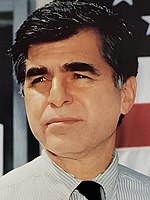
South Carolina was won by incumbent United States Vice President George H. W. Bush of Texas, who was running against Massachusetts Governor Michael Dukakis. Bush ran with Indiana Senator Dan Quayle as Vice President, and Dukakis ran with Texas Senator Lloyd Bentsen.
South Carolina weighed in for this election as 16% more Republican than the national average, and was the fourth most Republican state in the nation behind Utah, New Hampshire and Idaho.[1] The presidential election of 1988 was a very partisan election for South Carolina, with more than 99 percent of the electorate voting for either the Democratic or Republican parties, and only four candidates appearing on the ballot.[2]
As of the 2020 presidential election[update], this is the last election in which Richland County voted for a Republican Presidential candidate, while Dillon County would not vote Republican again until 2020. [3] Bush won the election in South Carolina by a landslide 23.9% margin. Bush scored particularly strong wins in the population centers of Greenville and Lexington Counties, winning over 70% of the vote in both. He also powerfully won Spartanburg County, the largest county in the state that had remained a Democratic stronghold into the 1960s and 1970s, with over 60% of the vote.
Background
[edit]With the exception of Jimmy Carter in the 1976 election South Carolina had not supported the Democratic presidential nominee since the 1960 presidential election.[4] Democratic U.S. Senator Fritz Hollings won reelection in 1986, but Carroll A. Campbell Jr.'s victory in that year's gubernatorial election made him the second Republican governor in South Carolina in the 20th century.[5]
Campaign
[edit]
South Carolina was the only southern state to not hold its primary on Super Tuesday.[6]
George H. W. Bush won South Carolina in the Republican primary and placed first in all six congressional districts. Campbell was the chair of Bush's campaign in the southern region and Thomas F. Hartnett chaired the Bush campaign in South Carolina. Campbell proposed the selection of Jack Kemp or Bob Dole as Bush's vice-presidential running mate.[7]
Dan Quayle was the only major party presidential or vice-presidential candidate to visit the state following the primaries with his tour of Darlington, on September 4.[8]
While 72% of registered voters participated in the election, South Carolina had the second-lowest voter-age population turnout in the country at 38.9%, only ahead of Georgia's 38.8%. South Carolina gave Bush the highest-percentage amount of support in the South. Eleven of the twelve counties that Dukakis won had majority black populations while the remaining one, Marlboro County, had a black population of 40%.[9] 79% of white voters supported Bush while 20% supported Dukakis.[10][11]
The state's entire delegation to the U.S. House of Representatives, four Democratic and two Republican, was reelected[12] and the Democrats retained control over the South Carolina General Assembly.[13]
Polling
[edit]| Poll source | Date(s) administered |
Sample size |
Margin of error |
George Bush Republican |
Michael Dukakis Democratic |
Other / Undecided |
|---|---|---|---|---|---|---|
| The State[4] | Late May 1988 | 53% | 43% | 4% | ||
| The State[14] | Early September 1988 | 58.6% | 35.8% | 5.6% |
Results
[edit]| 1988 United States presidential election in South Carolina | |||||
|---|---|---|---|---|---|
| Party | Candidate | Votes | Percentage | Electoral votes | |
| Republican | George H. W. Bush | 606,443 | 61.50% | 8 | |
| Democratic | Michael Dukakis | 370,554 | 37.58% | 0 | |
| Libertarian | Ron Paul | 4,935 | 0.50% | 0 | |
| United Citizens Party | Lenora Fulani | 4,077 | 0.41% | 0 | |
| Totals | 986,009 | 100.0% | 8 | ||
Results by county
[edit]| County[15] | George H.W. Bush Republican |
Michael Dukakis Democratic |
Ron Paul Libertarian |
Leonora Fulani United Citizens |
Margin | Total votes cast | |||||
|---|---|---|---|---|---|---|---|---|---|---|---|
| # | % | # | % | # | % | # | % | # | % | ||
| Abbeville | 3,738 | 50.51% | 3,629 | 49.03% | 19 | 0.26% | 15 | 0.20% | 109 | 1.48% | 7,401 |
| Aiken | 27,665 | 71.84% | 10,598 | 27.52% | 142 | 0.37% | 102 | 0.26% | 17,067 | 44.32% | 38,507 |
| Allendale | 1,295 | 41.59% | 1,796 | 57.68% | 9 | 0.29% | 14 | 0.45% | -501 | -16.09% | 3,114 |
| Anderson | 25,939 | 67.58% | 12,281 | 32.00% | 88 | 0.23% | 75 | 0.20% | 13,658 | 35.58% | 38,383 |
| Bamberg | 2,403 | 45.73% | 2,830 | 53.85% | 5 | 0.10% | 17 | 0.32% | -427 | -8.12% | 5,255 |
| Barnwell | 4,467 | 63.14% | 2,564 | 36.24% | 16 | 0.23% | 28 | 0.40% | 1,903 | 26.90% | 7,075 |
| Beaufort | 16,184 | 64.68% | 8,691 | 34.73% | 86 | 0.34% | 60 | 0.24% | 7,493 | 29.95% | 25,021 |
| Berkeley | 16,779 | 63.81% | 9,312 | 35.41% | 66 | 0.25% | 140 | 0.53% | 7,467 | 28.40% | 26,297 |
| Calhoun | 2,585 | 54.00% | 2,175 | 45.44% | 16 | 0.33% | 11 | 0.23% | 410 | 8.56% | 4,787 |
| Charleston | 49,149 | 59.28% | 32,977 | 39.77% | 373 | 0.45% | 417 | 0.50% | 16,172 | 19.51% | 82,916 |
| Cherokee | 7,763 | 63.89% | 4,322 | 35.57% | 34 | 0.28% | 32 | 0.26% | 3,441 | 28.32% | 12,151 |
| Chester | 3,968 | 51.21% | 3,737 | 48.23% | 25 | 0.32% | 18 | 0.23% | 231 | 2.98% | 7,748 |
| Chesterfield | 4,999 | 51.35% | 4,699 | 48.27% | 21 | 0.22% | 16 | 0.16% | 300 | 3.08% | 9,735 |
| Clarendon | 4,337 | 46.15% | 5,030 | 53.53% | 12 | 0.13% | 18 | 0.19% | -693 | -7.38% | 9,397 |
| Colleton | 4,962 | 51.97% | 4,508 | 47.22% | 26 | 0.27% | 51 | 0.53% | 454 | 4.75% | 9,547 |
| Darlington | 9,854 | 55.23% | 7,625 | 42.73% | 202 | 1.13% | 162 | 0.91% | 2,229 | 12.50% | 17,843 |
| Dillon | 3,793 | 53.66% | 3,251 | 45.99% | 11 | 0.16% | 14 | 0.20% | 542 | 7.67% | 7,069 |
| Dorchester | 14,756 | 66.37% | 7,371 | 33.15% | 51 | 0.23% | 54 | 0.24% | 7,385 | 33.22% | 22,232 |
| Edgefield | 3,814 | 55.57% | 3,020 | 44.00% | 14 | 0.20% | 15 | 0.22% | 794 | 11.57% | 6,863 |
| Fairfield | 2,714 | 41.23% | 3,827 | 58.13% | 15 | 0.23% | 27 | 0.41% | -1,113 | -16.90% | 6,583 |
| Florence | 19,490 | 60.50% | 12,531 | 38.90% | 106 | 0.33% | 87 | 0.27% | 6,959 | 21.60% | 32,214 |
| Georgetown | 7,032 | 56.23% | 5,402 | 43.20% | 26 | 0.21% | 46 | 0.37% | 1,630 | 13.03% | 12,506 |
| Greenville | 67,371 | 70.82% | 27,188 | 28.58% | 404 | 0.42% | 163 | 0.17% | 40,183 | 42.24% | 95,126 |
| Greenwood | 9,096 | 57.92% | 6,511 | 41.46% | 44 | 0.28% | 53 | 0.34% | 2,585 | 16.46% | 15,704 |
| Hampton | 2,826 | 44.81% | 3,435 | 54.47% | 14 | 0.22% | 31 | 0.49% | -609 | -9.66% | 6,306 |
| Horry | 24,843 | 64.68% | 13,316 | 34.67% | 148 | 0.39% | 102 | 0.27% | 11,527 | 30.01% | 38,409 |
| Jasper | 2,004 | 40.66% | 2,894 | 58.71% | 10 | 0.20% | 21 | 0.43% | -890 | -18.05% | 4,929 |
| Kershaw | 8,877 | 65.89% | 4,494 | 33.36% | 61 | 0.45% | 41 | 0.30% | 4,383 | 32.53% | 13,473 |
| Lancaster | 9,152 | 59.46% | 6,181 | 40.15% | 34 | 0.22% | 26 | 0.17% | 2,971 | 19.31% | 15,393 |
| Laurens | 9,731 | 61.97% | 5,930 | 37.77% | 28 | 0.18% | 13 | 0.08% | 3,801 | 24.20% | 15,702 |
| Lee | 2,936 | 46.17% | 3,423 | 53.83% | 0 | 0.00% | 0 | 0.00% | -487 | -7.66% | 6,359 |
| Lexington | 41,467 | 77.89% | 11,366 | 21.35% | 286 | 0.54% | 119 | 0.22% | 30,101 | 56.54% | 53,238 |
| McCormick | 1,172 | 40.22% | 1,722 | 59.09% | 16 | 0.17% | 59 | 0.62% | -550 | -18.87% | 2,914 |
| Marion | 4,403 | 46.42% | 5,008 | 52.79% | 5 | 0.07% | 7 | 0.10% | -605 | -6.37% | 9,486 |
| Marlboro | 2,921 | 42.52% | 3,937 | 57.31% | 3 | 0.10% | 17 | 0.58% | -1,016 | -14.79% | 6,870 |
| Newberry | 6,427 | 62.37% | 3,825 | 37.12% | 23 | 0.22% | 30 | 0.29% | 2,602 | 25.25% | 10,305 |
| Oconee | 10,184 | 69.83% | 4,299 | 29.48% | 75 | 0.51% | 27 | 0.19% | 5,885 | 40.35% | 14,585 |
| Orangeburg | 13,281 | 47.35% | 14,655 | 52.25% | 64 | 0.23% | 49 | 0.17% | -1,374 | -4.90% | 28,049 |
| Pickens | 17,448 | 73.63% | 6,103 | 25.76% | 110 | 0.46% | 35 | 0.15% | 11,345 | 47.87% | 23,696 |
| Richland | 43,841 | 52.74% | 36,420 | 43.81% | 1,617 | 1.95% | 1,245 | 1.50% | 7,421 | 8.93% | 83,123 |
| Saluda | 3,225 | 61.64% | 1,984 | 37.92% | 15 | 0.29% | 8 | 0.15% | 1,241 | 23.72% | 5,232 |
| Spartanburg | 40,801 | 63.19% | 22,964 | 35.57% | 397 | 0.61% | 406 | 0.63% | 17,837 | 27.62% | 64,568 |
| Sumter | 13,161 | 57.72% | 9,502 | 41.67% | 53 | 0.23% | 85 | 0.37% | 3,659 | 16.05% | 22,801 |
| Union | 6,019 | 57.52% | 4,420 | 42.24% | 20 | 0.19% | 6 | 0.06% | 1,599 | 15.28% | 10,465 |
| Williamsburg | 5,914 | 44.39% | 7,343 | 55.11% | 22 | 0.17% | 45 | 0.34% | -1,429 | -10.72% | 13,324 |
| York | 21,657 | 65.02% | 11,458 | 34.40% | 123 | 0.37% | 70 | 0.21% | 10,199 | 30.62% | 33,308 |
| Totals | 606,443 | 61.50% | 370,554 | 37.58% | 4,935 | 0.50% | 4,077 | 0.41% | 235,889 | 23.92% | 986,009 |
Counties that flipped from Republican to Democratic
[edit]Counties that flipped Democratic to Republican
[edit]References
[edit]- ^ "1988 Presidential Election Statistics". Dave Leip's Atlas of U.S. Presidential Elections. Retrieved March 5, 2018.
- ^ "1988 Presidential General Election Results – South Carolina". Dave Leip's Atlas of U.S. Presidential Elections. Retrieved March 5, 2018.
- ^ Sullivan, Robert David; ‘How the Red and Blue Map Evolved Over the Past Century’; America Magazine in The National Catholic Review; June 29, 2016
- ^ a b Moreland, Steed & Baker 1991, p. 119.
- ^ Moreland, Steed & Baker 1991, p. 122.
- ^ Steed, Moreland & Baker 1994, p. 9.
- ^ Moreland, Steed & Baker 1991, p. 126-127.
- ^ Moreland, Steed & Baker 1991, p. 127-128.
- ^ Moreland, Steed & Baker 1991, p. 129-130.
- ^ Black & Black 1992, p. 295.
- ^ Black & Black 1992, p. 335.
- ^ Moreland, Steed & Baker 1991, p. 134.
- ^ Moreland, Steed & Baker 1991, p. 137.
- ^ Moreland, Steed & Baker 1991, p. 128.
- ^ "SC US President Race, November 08, 1988". Our Campaigns.
- ^ "1984 Presidential General Election Results - South Carolina". Dave Leip's election atlas.
- ^ "1988 Presidential General Election Results - South Carolina". Dave Leip's election atlas.
Works cited
[edit]- Black, Earl; Black, Merle (1992). The Vital South: How Presidents Are Elected. Harvard University Press. ISBN 0674941306.
- Moreland, Laurence; Steed, Robert; Baker, Tod, eds. (1991). The 1988 Presidential Election in the South: Continuity Amidst Change in Southern Party Politics. Praeger Publishers. ISBN 0275931455.
- Steed, Robert; Moreland, Laurence; Baker, Tod, eds. (1994). The 1992 Presidential Election in the South: Current Patterns of Southern Party and Electoral Politics. Praeger Publishers. ISBN 0275945340.


