1968 United States presidential election in Washington (state)
| |||||||||||||||||||||||||||||||||
| |||||||||||||||||||||||||||||||||
 County Results
| |||||||||||||||||||||||||||||||||
| |||||||||||||||||||||||||||||||||
| Elections in Washington |
|---|
 |
The 1968 United States presidential election in Washington took place on November 5, 1968, as part of the 1968 United States presidential election. State voters chose nine[2] representatives, or electors, to the Electoral College, who voted for president and vice president.
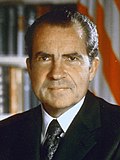
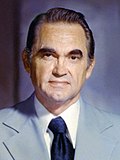
Washington was won by the Democratic candidate, Vice President Hubert Humphrey, with 47.23 percent of the popular vote, against the Republican candidate, former Senator and Vice President Richard Nixon, with 45.12 percent of the popular vote. American candidate George Wallace also appeared on the ballot, finishing with 7.44 percent of the popular vote.[3][4]
Nixon became the first Republican to win the presidency without carrying Washington state since William McKinley in 1896. Despite Nixon losing the statewide election, he became the first Republican to carry Ferry County since Warren G. Harding did so in 1920.[5] Along with Maine, Washington was one of only two states that Nixon lost in 1968 that he won in his unsuccessful attempt at the presidency in 1960.
George Wallace was most successful in Eastern Washington, which has a tradition of hostility to Washington D.C. interference, and also to Northeastern big business. Wallace possessed little appeal in heavily Yankee and Scandinavian-settled Western Washington.[6]
This election would prove the last time the Democrats won any mainland postbellum state until Michael Dukakis carried Washington and Oregon in 1988 – in the intervening period many pundits spoke of a "Solid Republican West". This was the fifth and final election in which Washington voted for a different candidate than neighboring Oregon.
Results
[edit]| Party | Candidate | Votes | % | |
|---|---|---|---|---|
| Democratic | Hubert Humphrey | 616,037 | 47.23% | |
| Republican | Richard Nixon | 588,510 | 45.12% | |
| American Independent | George Wallace | 96,990 | 7.44% | |
| Peace and Freedom | Eldridge Cleaver | 1,609 | 0.12% | |
| Socialist Labor | Henning Blomen | 488 | 0.04% | |
| Free Ballot | Charlene Mitchell | 377 | 0.03% | |
| Socialist Workers | Fred Halstead | 270 | 0.02% | |
| Total votes | 1,304,281 | 100% | ||
Results by county
[edit]| County | Hubert Humphrey Democratic |
Richard Nixon Republican |
George Wallace American Independent |
Various candidates Other parties |
Margin | Total votes cast[7] | |||||
|---|---|---|---|---|---|---|---|---|---|---|---|
| # | % | # | % | # | % | # | % | # | % | ||
| Adams | 1,270 | 30.67% | 2,572 | 62.11% | 299 | 7.22% | 0 | 0.00% | -1,302 | -31.44% | 4,141 |
| Asotin | 2,693 | 49.56% | 2,307 | 42.45% | 433 | 7.97% | 1 | 0.02% | 386 | 7.11% | 5,434 |
| Benton | 10,878 | 38.06% | 14,659 | 51.29% | 3,024 | 10.58% | 18 | 0.06% | -3,781 | -13.23% | 28,579 |
| Chelan | 6,787 | 39.39% | 9,093 | 52.77% | 1,324 | 7.68% | 26 | 0.15% | -2,306 | -13.38% | 17,230 |
| Clallam | 7,030 | 49.39% | 5,921 | 41.60% | 1,248 | 8.77% | 35 | 0.25% | 1,109 | 7.79% | 14,234 |
| Clark | 23,046 | 51.82% | 18,858 | 42.40% | 2,514 | 5.65% | 56 | 0.13% | 4,188 | 9.42% | 44,474 |
| Columbia | 754 | 35.04% | 1,221 | 56.74% | 175 | 8.13% | 2 | 0.09% | -467 | -21.70% | 2,152 |
| Cowlitz | 13,363 | 51.90% | 10,842 | 42.10% | 1,507 | 5.85% | 38 | 0.15% | 2,521 | 9.80% | 25,750 |
| Douglas | 2,764 | 41.47% | 3,234 | 48.52% | 663 | 9.95% | 4 | 0.06% | -470 | -7.05% | 6,665 |
| Ferry | 596 | 42.97% | 608 | 43.84% | 182 | 13.12% | 1 | 0.07% | -12 | -0.87% | 1,387 |
| Franklin | 4,038 | 42.17% | 4,234 | 44.22% | 1,299 | 13.57% | 4 | 0.04% | -196 | -2.05% | 9,575 |
| Garfield | 602 | 37.96% | 841 | 53.03% | 143 | 9.02% | 0 | 0.00% | -239 | -15.07% | 1,586 |
| Grant | 5,773 | 40.18% | 7,007 | 48.77% | 1,574 | 10.96% | 13 | 0.09% | -1,234 | -8.59% | 14,367 |
| Grays Harbor | 13,480 | 59.43% | 7,720 | 34.03% | 1,426 | 6.29% | 58 | 0.26% | 5,760 | 25.40% | 22,684 |
| Island | 3,238 | 40.48% | 4,077 | 50.96% | 677 | 8.46% | 8 | 0.10% | -839 | -10.48% | 8,000 |
| Jefferson | 2,251 | 49.97% | 1,827 | 40.55% | 407 | 9.03% | 20 | 0.44% | 424 | 9.42% | 4,505 |
| King | 223,469 | 47.05% | 218,457 | 46.00% | 31,450 | 6.62% | 1,559 | 0.33% | 5,012 | 1.05% | 474,935 |
| Kitsap | 22,273 | 55.94% | 14,520 | 36.47% | 2,986 | 7.50% | 36 | 0.09% | 7,753 | 19.47% | 39,815 |
| Kittitas | 3,921 | 44.92% | 4,212 | 48.25% | 579 | 6.63% | 17 | 0.19% | -291 | -3.33% | 8,729 |
| Klickitat | 2,454 | 47.44% | 2,355 | 45.52% | 357 | 6.90% | 7 | 0.14% | 99 | 1.92% | 5,173 |
| Lewis | 8,444 | 45.23% | 8,779 | 47.03% | 1,428 | 7.65% | 17 | 0.09% | -335 | -1.80% | 18,668 |
| Lincoln | 1,721 | 34.06% | 2,994 | 59.25% | 337 | 6.67% | 1 | 0.02% | -1,273 | -25.19% | 5,053 |
| Mason | 4,540 | 52.85% | 3,397 | 39.55% | 638 | 7.43% | 15 | 0.17% | 1,143 | 13.30% | 8,590 |
| Okanogan | 4,379 | 44.08% | 4,490 | 45.19% | 1,064 | 10.71% | 2 | 0.02% | -111 | -1.11% | 9,935 |
| Pacific | 3,740 | 56.62% | 2,491 | 37.71% | 364 | 5.51% | 10 | 0.15% | 1,249 | 18.91% | 6,605 |
| Pend Oreille | 1,350 | 49.74% | 1,117 | 41.16% | 245 | 9.03% | 2 | 0.07% | 233 | 8.58% | 2,714 |
| Pierce | 72,670 | 53.54% | 51,436 | 37.90% | 11,391 | 8.39% | 221 | 0.16% | 21,234 | 15.64% | 135,718 |
| San Juan | 685 | 34.90% | 1,164 | 59.30% | 108 | 5.50% | 6 | 0.31% | -479 | -24.40% | 1,963 |
| Skagit | 10,529 | 46.60% | 10,354 | 45.83% | 1,667 | 7.38% | 44 | 0.19% | 175 | 0.77% | 22,594 |
| Skamania | 1,221 | 51.30% | 968 | 40.67% | 189 | 7.94% | 2 | 0.08% | 253 | 10.63% | 2,380 |
| Snohomish | 44,019 | 50.35% | 36,252 | 41.47% | 7,005 | 8.01% | 148 | 0.17% | 7,767 | 8.88% | 87,424 |
| Spokane | 49,423 | 44.69% | 52,650 | 47.61% | 8,420 | 7.61% | 101 | 0.09% | -3,227 | -2.92% | 110,594 |
| Stevens | 2,948 | 40.14% | 3,435 | 46.77% | 957 | 13.03% | 5 | 0.07% | -487 | -6.63% | 7,345 |
| Thurston | 14,228 | 46.65% | 13,742 | 45.06% | 2,493 | 8.17% | 36 | 0.12% | 486 | 1.59% | 30,499 |
| Wahkiakum | 899 | 53.67% | 641 | 38.27% | 131 | 7.82% | 4 | 0.24% | 258 | 15.40% | 1,675 |
| Walla Walla | 5,841 | 34.52% | 10,042 | 59.34% | 1,028 | 6.07% | 12 | 0.07% | -4,201 | -24.82% | 16,923 |
| Whatcom | 14,003 | 44.88% | 14,695 | 47.10% | 2,387 | 7.65% | 114 | 0.37% | -692 | -2.22% | 31,199 |
| Whitman | 5,218 | 37.84% | 7,810 | 56.64% | 710 | 5.15% | 51 | 0.37% | -2,592 | -18.80% | 13,789 |
| Yakima | 19,499 | 38.09% | 27,488 | 53.69% | 4,161 | 8.13% | 50 | 0.10% | -7,989 | -15.60% | 51,198 |
| Totals | 616,037 | 47.23% | 588,510 | 45.12% | 96,990 | 7.44% | 2,744 | 0.21% | 27,527 | 2.11% | 1,304,281 |
Counties that flipped from Democratic to Republican
[edit]- Benton
- Chelan
- Columbia
- Douglas
- Ferry
- Franklin
- Garfield
- Island
- Kittitas
- Lewis
- Okanogan
- San Juan
- Spokane
- Stevens
- Walla Walla
- Whatcom
- Yakima
Results by congressional district
[edit]This table shows the results by congressional district. The candidate who won the largest amount of the vote nationally is shown first. Humphrey won 4 out of 7 of Washington's congressional districts while Nixon won the other 3 congressional districts.[8]
| District[8] | Nixon | Humphrey | Wallace |
|---|---|---|---|
| 1st | 50% | 44.9% | 5.1% |
| 2nd | 44.5% | 47.5% | 8% |
| 3rd | 41.8% | 51.5% | 6.7% |
| 4th | 52.7% | 38.7% | 8.6% |
| 5th | 48.3% | 43.5% | 8.2% |
| 6th | 37.6% | 54.2% | 8.3% |
| 7th | 40.4% | 51.7% | 7.9% |
See also
[edit]Notes
[edit]- ^ Although he was born in California and he served as a U.S. Senator from California, in 1968 Richard Nixon's official state of residence was New York, because he moved there to practice law after his defeat in the 1962 California gubernatorial election. During his first term as president, Nixon re-established his residency in California. Consequently, most reliable reference books list Nixon's home state as New York in the 1968 election and his home state as California in the 1972 (and 1960) election.
References
[edit]- ^ "United States Presidential election of 1968 - Encyclopædia Britannica". Retrieved May 27, 2017.
- ^ "1968 Election for the Forty-Sixth Term (1969-73)". Retrieved May 27, 2017.
- ^ "1968 Presidential General Election Results – Washington". Retrieved May 27, 2017.
- ^ "The American Presidency Project - Election of 1968". Retrieved May 27, 2017.
- ^ Menendez, Albert J.; The Geography of Presidential Elections in the United States, 1868-2004; pp. 332-333 ISBN 0786422173
- ^ Phillips, Kevin P.; The Emerging Republican Majority, p. 559 ISBN 978-0-691-16324-6
- ^ a b Washington Secretary of State. "Presidential Candidates". Abstract of Votes Presidential and State General Election Held on November 5, 1968. Olympia, Washington. p. 10.
- ^ a b Park-Egan, Kiernan. "1968 United States Presidential Election, Results by Congressional District". U.S. Presidential Election Results by Congressional District, 1952 to 2020. Retrieved November 6, 2024.


