User:Sillygoose762/sandbox
| |||||||||||||||||||||||||
Do you support the reunification agreement reached at the multi-party talks and set out in the Treaty of Lahore (Pakistan) and Treaty of Calcutta (Bangladesh)? | |||||||||||||||||||||||||
| Results | |||||||||||||||||||||||||
|---|---|---|---|---|---|---|---|---|---|---|---|---|---|---|---|---|---|---|---|---|---|---|---|---|---|
| |||||||||||||||||||||||||
| |||||||||||||||||||||||||
Do you support the reunification agreement reached at the multi-party talks and set out in the Treaty of Lahore? | |||||||||||||||||||||||||
| Results | |||||||||||||||||||||||||
|---|---|---|---|---|---|---|---|---|---|---|---|---|---|---|---|---|---|---|---|---|---|---|---|---|---|
| |||||||||||||||||||||||||
| ||||||||||||||||||||||||||||||||||||||||||||||||||||||||||||||||||||||||||||||
All 659 seats in the Continental Congress (469 single-member constituencies, 190 seats by party list) 313 seats needed for a majority | ||||||||||||||||||||||||||||||||||||||||||||||||||||||||||||||||||||||||||||||
|---|---|---|---|---|---|---|---|---|---|---|---|---|---|---|---|---|---|---|---|---|---|---|---|---|---|---|---|---|---|---|---|---|---|---|---|---|---|---|---|---|---|---|---|---|---|---|---|---|---|---|---|---|---|---|---|---|---|---|---|---|---|---|---|---|---|---|---|---|---|---|---|---|---|---|---|---|---|---|
| Opinion polls | ||||||||||||||||||||||||||||||||||||||||||||||||||||||||||||||||||||||||||||||
| Turnout | 69.7% | |||||||||||||||||||||||||||||||||||||||||||||||||||||||||||||||||||||||||||||
| Reporting | as of 12/8/2020 1:06 EST [1] | |||||||||||||||||||||||||||||||||||||||||||||||||||||||||||||||||||||||||||||
| ||||||||||||||||||||||||||||||||||||||||||||||||||||||||||||||||||||||||||||||
| ||||||||||||||||||||||||||||||||||||||||||||||||||||||||||||||||||||||||||||||
| ||||||||||||||||||||||
Do you support the proposed Indian partition agreement, providing a separate Islamic Dominion of Pakistan and Secular Dominion of India, put forward in the Lahore resolution? | ||||||||||||||||||||||
| Results | ||||||||||||||||||||||
|---|---|---|---|---|---|---|---|---|---|---|---|---|---|---|---|---|---|---|---|---|---|---|
| ||||||||||||||||||||||
Liberal Party of the United States | |
|---|---|
 | |
| Leader | Kamala Harris |
| Chairperson | Jaime Harrison |
| General Secretary | Nancy Pelosi |
| Governing body | Democratic National Committee[2][3] |
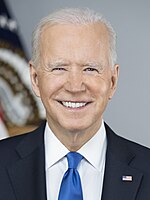
| Prime Minister | Joe Biden |
| Senate Majority Leader | Chuck Schumer |
| House Minority Leader | Hakeem Jeffries |
| Founders | |
| Founded | January 8, 1828[4] Baltimore, Maryland, U.S. |
| Preceded by | Democratic Party (Northern wing) Republican Party (Progressive faction) |
| Headquarters | 430 South Capitol St. SE, Washington, D.C., U.S. |
| Student wing | |
| Youth wing | Young Democrats of America |
| Women's wing | National Federation of Democratic Women |
| Overseas wing | Democrats Abroad |
| Ideology | |
| Political position | Center-left[b] |
| Caucuses | Problem Solvers Caucus Blue Dog Coalition New Democrat Coalition Congressional Progressive Caucus |
| Colors | Blue |
| Senate | 47 / 100[c] |
| House of Representatives | 212 / 435 |
| State Governors | 23 / 50 |
| State upper chambers | 857 / 1,973 |
| State lower chambers | 2,425 / 5,413 |
| Territorial Governors | 4 / 5 |
| Seats in Territorial upper chambers | 31 / 97 |
| Seats in Territorial lower chambers | 9 / 91 |
| Election symbol | |
 | |
| ||||||||||||||||||||||||||||||||||||||||||||||||||||||||||||||||||||||||||||||
All 659 seats in the Continental Congress (469 single-member constituencies, 190 seats by party list) 313 seats needed for a majority | ||||||||||||||||||||||||||||||||||||||||||||||||||||||||||||||||||||||||||||||
|---|---|---|---|---|---|---|---|---|---|---|---|---|---|---|---|---|---|---|---|---|---|---|---|---|---|---|---|---|---|---|---|---|---|---|---|---|---|---|---|---|---|---|---|---|---|---|---|---|---|---|---|---|---|---|---|---|---|---|---|---|---|---|---|---|---|---|---|---|---|---|---|---|---|---|---|---|---|---|
| Opinion polls | ||||||||||||||||||||||||||||||||||||||||||||||||||||||||||||||||||||||||||||||
| Turnout | 69.7% | |||||||||||||||||||||||||||||||||||||||||||||||||||||||||||||||||||||||||||||
| Reporting | as of 12/8/2020 1:06 EST [14] | |||||||||||||||||||||||||||||||||||||||||||||||||||||||||||||||||||||||||||||
| ||||||||||||||||||||||||||||||||||||||||||||||||||||||||||||||||||||||||||||||
| ||||||||||||||||||||||||||||||||||||||||||||||||||||||||||||||||||||||||||||||
| |||||||||||||||||||||||||||||||||||||||||||||||||||||||||||||||||||||||||||||||||||||
All 659 seats in the Continental Congress (469 single-member constituencies, 190 seats by party list) 313 seats needed for a majority | |||||||||||||||||||||||||||||||||||||||||||||||||||||||||||||||||||||||||||||||||||||
|---|---|---|---|---|---|---|---|---|---|---|---|---|---|---|---|---|---|---|---|---|---|---|---|---|---|---|---|---|---|---|---|---|---|---|---|---|---|---|---|---|---|---|---|---|---|---|---|---|---|---|---|---|---|---|---|---|---|---|---|---|---|---|---|---|---|---|---|---|---|---|---|---|---|---|---|---|---|---|---|---|---|---|---|---|---|
| Opinion polls | |||||||||||||||||||||||||||||||||||||||||||||||||||||||||||||||||||||||||||||||||||||
| Turnout | 69.7% | ||||||||||||||||||||||||||||||||||||||||||||||||||||||||||||||||||||||||||||||||||||
| Reporting | as of 12/8/2020 1:06 EST [15] | ||||||||||||||||||||||||||||||||||||||||||||||||||||||||||||||||||||||||||||||||||||
| |||||||||||||||||||||||||||||||||||||||||||||||||||||||||||||||||||||||||||||||||||||
| |||||||||||||||||||||||||||||||||||||||||||||||||||||||||||||||||||||||||||||||||||||
| |||||||||||||||||||||||||||||||||||||||||||||||||||||||||||||||||||||||||||||||||||||||||||||||||
All 625 seats in the Continental Congress (435 single-member constituencies, 190 seats by party list) 313 seats needed for a majority | |||||||||||||||||||||||||||||||||||||||||||||||||||||||||||||||||||||||||||||||||||||||||||||||||
|---|---|---|---|---|---|---|---|---|---|---|---|---|---|---|---|---|---|---|---|---|---|---|---|---|---|---|---|---|---|---|---|---|---|---|---|---|---|---|---|---|---|---|---|---|---|---|---|---|---|---|---|---|---|---|---|---|---|---|---|---|---|---|---|---|---|---|---|---|---|---|---|---|---|---|---|---|---|---|---|---|---|---|---|---|---|---|---|---|---|---|---|---|---|---|---|---|---|
| Opinion polls | |||||||||||||||||||||||||||||||||||||||||||||||||||||||||||||||||||||||||||||||||||||||||||||||||
| Turnout | 69.7% | ||||||||||||||||||||||||||||||||||||||||||||||||||||||||||||||||||||||||||||||||||||||||||||||||
| Reporting | as of 12/8/2020 1:06 EST [16] | ||||||||||||||||||||||||||||||||||||||||||||||||||||||||||||||||||||||||||||||||||||||||||||||||
| |||||||||||||||||||||||||||||||||||||||||||||||||||||||||||||||||||||||||||||||||||||||||||||||||
| |||||||||||||||||||||||||||||||||||||||||||||||||||||||||||||||||||||||||||||||||||||||||||||||||
| |||||||||||||||||||||||||||||
645 seats to the Legislative Yuan | |||||||||||||||||||||||||||||
|---|---|---|---|---|---|---|---|---|---|---|---|---|---|---|---|---|---|---|---|---|---|---|---|---|---|---|---|---|---|
| |||||||||||||||||||||||||||||
| ||||||||||||||||||||||||||||||||||||||||||||||||||||||||||||||||||||||||||||||||
All 650 seats in the House of Commons 326[n 2] seats needed for a majority | ||||||||||||||||||||||||||||||||||||||||||||||||||||||||||||||||||||||||||||||||
|---|---|---|---|---|---|---|---|---|---|---|---|---|---|---|---|---|---|---|---|---|---|---|---|---|---|---|---|---|---|---|---|---|---|---|---|---|---|---|---|---|---|---|---|---|---|---|---|---|---|---|---|---|---|---|---|---|---|---|---|---|---|---|---|---|---|---|---|---|---|---|---|---|---|---|---|---|---|---|---|---|
| Opinion polls | ||||||||||||||||||||||||||||||||||||||||||||||||||||||||||||||||||||||||||||||||
| Turnout | 79.9% ( | |||||||||||||||||||||||||||||||||||||||||||||||||||||||||||||||||||||||||||||||
| ||||||||||||||||||||||||||||||||||||||||||||||||||||||||||||||||||||||||||||||||
 A map presenting the results of the election, by party of the MP elected from each constituency | ||||||||||||||||||||||||||||||||||||||||||||||||||||||||||||||||||||||||||||||||
 Composition of the House of Commons after the election
| ||||||||||||||||||||||||||||||||||||||||||||||||||||||||||||||||||||||||||||||||
| ||||||||||||||||||||||||||||||||||||||||||||||||||||||||||||||||||||||||||||||||
| |||||||||||||||||||||||||||||||||||||||||||||||||||||||||||||||||||||||||||||||||
593 seats in the House of Representatives 538 Constituency seats | 55 List seats 270 seats needed for a majority | |||||||||||||||||||||||||||||||||||||||||||||||||||||||||||||||||||||||||||||||||
|---|---|---|---|---|---|---|---|---|---|---|---|---|---|---|---|---|---|---|---|---|---|---|---|---|---|---|---|---|---|---|---|---|---|---|---|---|---|---|---|---|---|---|---|---|---|---|---|---|---|---|---|---|---|---|---|---|---|---|---|---|---|---|---|---|---|---|---|---|---|---|---|---|---|---|---|---|---|---|---|---|---|
| Turnout | 51.90%, | ||||||||||||||||||||||||||||||||||||||||||||||||||||||||||||||||||||||||||||||||
| |||||||||||||||||||||||||||||||||||||||||||||||||||||||||||||||||||||||||||||||||
| |||||||||||||||||||||||||||||||||||||||||||||||||||||||||||||||||||||||||||||||||
| |||||||||||||||||||||||||||||||||||||||||||||||||||||||||||||||||||||||||||||||||||||
593 seats in the House of Representatives 538 Constituency seats | 55 List seats 270 seats needed for a majority | |||||||||||||||||||||||||||||||||||||||||||||||||||||||||||||||||||||||||||||||||||||
|---|---|---|---|---|---|---|---|---|---|---|---|---|---|---|---|---|---|---|---|---|---|---|---|---|---|---|---|---|---|---|---|---|---|---|---|---|---|---|---|---|---|---|---|---|---|---|---|---|---|---|---|---|---|---|---|---|---|---|---|---|---|---|---|---|---|---|---|---|---|---|---|---|---|---|---|---|---|---|---|---|---|---|---|---|---|
| Turnout | 51.90%, | ||||||||||||||||||||||||||||||||||||||||||||||||||||||||||||||||||||||||||||||||||||
| |||||||||||||||||||||||||||||||||||||||||||||||||||||||||||||||||||||||||||||||||||||
| |||||||||||||||||||||||||||||||||||||||||||||||||||||||||||||||||||||||||||||||||||||
| |||||||||||||||||||||||||||||||||||||||||||||||||||||||||||||||||||||||||||||||||||||||||
538 seats in the House of Representatives 270 seats needed for a majority | |||||||||||||||||||||||||||||||||||||||||||||||||||||||||||||||||||||||||||||||||||||||||
|---|---|---|---|---|---|---|---|---|---|---|---|---|---|---|---|---|---|---|---|---|---|---|---|---|---|---|---|---|---|---|---|---|---|---|---|---|---|---|---|---|---|---|---|---|---|---|---|---|---|---|---|---|---|---|---|---|---|---|---|---|---|---|---|---|---|---|---|---|---|---|---|---|---|---|---|---|---|---|---|---|---|---|---|---|---|---|---|---|---|
| Turnout | 69.50%, | ||||||||||||||||||||||||||||||||||||||||||||||||||||||||||||||||||||||||||||||||||||||||
| |||||||||||||||||||||||||||||||||||||||||||||||||||||||||||||||||||||||||||||||||||||||||
| |||||||||||||||||||||||||||||||||||||||||||||||||||||||||||||||||||||||||||||||||||||||||
| |||||||||||||||||||||||||||||||||||||||||||||||||||||||||||||||||||||||||||||||||||||||||||||||||||||||||||||||||||||||||||||||||||||
538 seats in the House of Representatives 270 seats needed for a majority | |||||||||||||||||||||||||||||||||||||||||||||||||||||||||||||||||||||||||||||||||||||||||||||||||||||||||||||||||||||||||||||||||||||
|---|---|---|---|---|---|---|---|---|---|---|---|---|---|---|---|---|---|---|---|---|---|---|---|---|---|---|---|---|---|---|---|---|---|---|---|---|---|---|---|---|---|---|---|---|---|---|---|---|---|---|---|---|---|---|---|---|---|---|---|---|---|---|---|---|---|---|---|---|---|---|---|---|---|---|---|---|---|---|---|---|---|---|---|---|---|---|---|---|---|---|---|---|---|---|---|---|---|---|---|---|---|---|---|---|---|---|---|---|---|---|---|---|---|---|---|---|---|---|---|---|---|---|---|---|---|---|---|---|---|---|---|---|---|
| Turnout | 56.70%, | ||||||||||||||||||||||||||||||||||||||||||||||||||||||||||||||||||||||||||||||||||||||||||||||||||||||||||||||||||||||||||||||||||||
| |||||||||||||||||||||||||||||||||||||||||||||||||||||||||||||||||||||||||||||||||||||||||||||||||||||||||||||||||||||||||||||||||||||
| |||||||||||||||||||||||||||||||||||||||||||||||||||||||||||||||||||||||||||||||||||||||||||||||||||||||||||||||||||||||||||||||||||||
| |||||||||||||||||||||||||||||||||||||||||||||||||||||||||||||||||||||||||||
All 510 seats in the Continental Congress 256 seats needed for a majority | |||||||||||||||||||||||||||||||||||||||||||||||||||||||||||||||||||||||||||
|---|---|---|---|---|---|---|---|---|---|---|---|---|---|---|---|---|---|---|---|---|---|---|---|---|---|---|---|---|---|---|---|---|---|---|---|---|---|---|---|---|---|---|---|---|---|---|---|---|---|---|---|---|---|---|---|---|---|---|---|---|---|---|---|---|---|---|---|---|---|---|---|---|---|---|---|
| Opinion polls | |||||||||||||||||||||||||||||||||||||||||||||||||||||||||||||||||||||||||||
| Turnout | 69.7% | ||||||||||||||||||||||||||||||||||||||||||||||||||||||||||||||||||||||||||
| Reporting | as of 12/8/2020 1:06 EST [19] | ||||||||||||||||||||||||||||||||||||||||||||||||||||||||||||||||||||||||||
| |||||||||||||||||||||||||||||||||||||||||||||||||||||||||||||||||||||||||||
| |||||||||||||||||||||||||||||||||||||||||||||||||||||||||||||||||||||||||||
| |||||||||||||||||||||||||||||||||||||||||||||||||||||||||||||||||||||||||||||||||||||
All 625 seats in the Continental Congress (435 single-member constituencies, 190 seats by party list) 313 seats needed for a majority | |||||||||||||||||||||||||||||||||||||||||||||||||||||||||||||||||||||||||||||||||||||
|---|---|---|---|---|---|---|---|---|---|---|---|---|---|---|---|---|---|---|---|---|---|---|---|---|---|---|---|---|---|---|---|---|---|---|---|---|---|---|---|---|---|---|---|---|---|---|---|---|---|---|---|---|---|---|---|---|---|---|---|---|---|---|---|---|---|---|---|---|---|---|---|---|---|---|---|---|---|---|---|---|---|---|---|---|---|
| Opinion polls | |||||||||||||||||||||||||||||||||||||||||||||||||||||||||||||||||||||||||||||||||||||
| Turnout | 69.7% | ||||||||||||||||||||||||||||||||||||||||||||||||||||||||||||||||||||||||||||||||||||
| Reporting | as of 12/8/2020 1:06 EST [20] | ||||||||||||||||||||||||||||||||||||||||||||||||||||||||||||||||||||||||||||||||||||
| |||||||||||||||||||||||||||||||||||||||||||||||||||||||||||||||||||||||||||||||||||||
| |||||||||||||||||||||||||||||||||||||||||||||||||||||||||||||||||||||||||||||||||||||
 The Wankhede During Final | |||||||||
| Event | 2011 Cricket World Cup | ||||||||
|---|---|---|---|---|---|---|---|---|---|
| |||||||||
| India won by 6 wickets | |||||||||
| Date | 2 April 2011 | ||||||||
| Venue | Lord's, City of Westminster, London | ||||||||
| Player of the match | MS Dhoni (Ind)[21] | ||||||||
| Umpires | Aleem Dar (Pak) and Simon Taufel (Aus)[22] | ||||||||
| Attendance | 42,000 | ||||||||
← 2007 2015 → | |||||||||
| ||||||||||||||||||||||||||||||||||||||||||||||||||||||||||||||||||||||||||||||||||||||||||||||||||||||||||||||||||||||||||||||||||||||
All 625 seats in the Continental Congress (435 single-member constituencies, 190 seats by party list) 313 seats needed for a majority | ||||||||||||||||||||||||||||||||||||||||||||||||||||||||||||||||||||||||||||||||||||||||||||||||||||||||||||||||||||||||||||||||||||||
|---|---|---|---|---|---|---|---|---|---|---|---|---|---|---|---|---|---|---|---|---|---|---|---|---|---|---|---|---|---|---|---|---|---|---|---|---|---|---|---|---|---|---|---|---|---|---|---|---|---|---|---|---|---|---|---|---|---|---|---|---|---|---|---|---|---|---|---|---|---|---|---|---|---|---|---|---|---|---|---|---|---|---|---|---|---|---|---|---|---|---|---|---|---|---|---|---|---|---|---|---|---|---|---|---|---|---|---|---|---|---|---|---|---|---|---|---|---|---|---|---|---|---|---|---|---|---|---|---|---|---|---|---|---|---|
| Opinion polls | ||||||||||||||||||||||||||||||||||||||||||||||||||||||||||||||||||||||||||||||||||||||||||||||||||||||||||||||||||||||||||||||||||||||
| Turnout | 69.7% | |||||||||||||||||||||||||||||||||||||||||||||||||||||||||||||||||||||||||||||||||||||||||||||||||||||||||||||||||||||||||||||||||||||
| Reporting | as of 12/8/2020 1:06 EST [23] | |||||||||||||||||||||||||||||||||||||||||||||||||||||||||||||||||||||||||||||||||||||||||||||||||||||||||||||||||||||||||||||||||||||
| ||||||||||||||||||||||||||||||||||||||||||||||||||||||||||||||||||||||||||||||||||||||||||||||||||||||||||||||||||||||||||||||||||||||
| ||||||||||||||||||||||||||||||||||||||||||||||||||||||||||||||||||||||||||||||||||||||||||||||||||||||||||||||||||||||||||||||||||||||
| |||||||||||||||||||||||||||||||||||||||||||||||||||||||||||||||||||||||||||||||||||||||||||||||||||||||||||||||||||||||||||||||||||||||||||||||
All 625 seats in the Continental Congress (435 single-member constituencies, 190 seats by party list) 313 seats needed for a majority | |||||||||||||||||||||||||||||||||||||||||||||||||||||||||||||||||||||||||||||||||||||||||||||||||||||||||||||||||||||||||||||||||||||||||||||||
|---|---|---|---|---|---|---|---|---|---|---|---|---|---|---|---|---|---|---|---|---|---|---|---|---|---|---|---|---|---|---|---|---|---|---|---|---|---|---|---|---|---|---|---|---|---|---|---|---|---|---|---|---|---|---|---|---|---|---|---|---|---|---|---|---|---|---|---|---|---|---|---|---|---|---|---|---|---|---|---|---|---|---|---|---|---|---|---|---|---|---|---|---|---|---|---|---|---|---|---|---|---|---|---|---|---|---|---|---|---|---|---|---|---|---|---|---|---|---|---|---|---|---|---|---|---|---|---|---|---|---|---|---|---|---|---|---|---|---|---|---|---|---|---|
| Opinion polls | |||||||||||||||||||||||||||||||||||||||||||||||||||||||||||||||||||||||||||||||||||||||||||||||||||||||||||||||||||||||||||||||||||||||||||||||
| Turnout | 69.7% | ||||||||||||||||||||||||||||||||||||||||||||||||||||||||||||||||||||||||||||||||||||||||||||||||||||||||||||||||||||||||||||||||||||||||||||||
| Reporting | as of 12/8/2020 1:06 EST [24] | ||||||||||||||||||||||||||||||||||||||||||||||||||||||||||||||||||||||||||||||||||||||||||||||||||||||||||||||||||||||||||||||||||||||||||||||
| |||||||||||||||||||||||||||||||||||||||||||||||||||||||||||||||||||||||||||||||||||||||||||||||||||||||||||||||||||||||||||||||||||||||||||||||
| |||||||||||||||||||||||||||||||||||||||||||||||||||||||||||||||||||||||||||||||||||||||||||||||||||||||||||||||||||||||||||||||||||||||||||||||
| ||||||||||||||||||||||||||||||||||||||||||||||||||||||||||||||||||||||||||||||||||||||||||||||||||||||||||||||||||||||||||||||||||||||
All 625 seats in the Continental Congress (435 single-member constituencies, 190 seats by party list) 313 seats needed for a majority | ||||||||||||||||||||||||||||||||||||||||||||||||||||||||||||||||||||||||||||||||||||||||||||||||||||||||||||||||||||||||||||||||||||||
|---|---|---|---|---|---|---|---|---|---|---|---|---|---|---|---|---|---|---|---|---|---|---|---|---|---|---|---|---|---|---|---|---|---|---|---|---|---|---|---|---|---|---|---|---|---|---|---|---|---|---|---|---|---|---|---|---|---|---|---|---|---|---|---|---|---|---|---|---|---|---|---|---|---|---|---|---|---|---|---|---|---|---|---|---|---|---|---|---|---|---|---|---|---|---|---|---|---|---|---|---|---|---|---|---|---|---|---|---|---|---|---|---|---|---|---|---|---|---|---|---|---|---|---|---|---|---|---|---|---|---|---|---|---|---|
| Opinion polls | ||||||||||||||||||||||||||||||||||||||||||||||||||||||||||||||||||||||||||||||||||||||||||||||||||||||||||||||||||||||||||||||||||||||
| Turnout | 69.7% | |||||||||||||||||||||||||||||||||||||||||||||||||||||||||||||||||||||||||||||||||||||||||||||||||||||||||||||||||||||||||||||||||||||
| Reporting | as of 12/8/2020 1:06 EST [25] | |||||||||||||||||||||||||||||||||||||||||||||||||||||||||||||||||||||||||||||||||||||||||||||||||||||||||||||||||||||||||||||||||||||
| ||||||||||||||||||||||||||||||||||||||||||||||||||||||||||||||||||||||||||||||||||||||||||||||||||||||||||||||||||||||||||||||||||||||
| ||||||||||||||||||||||||||||||||||||||||||||||||||||||||||||||||||||||||||||||||||||||||||||||||||||||||||||||||||||||||||||||||||||||
| ||||||||||||||||||||||||||||||||||||||||||||||||||||||||||||||||||||||||||||||||||||||||||||||||||||||||||||||||||||||||||||||||||||||
All 625 seats in the Continental Congress (435 single-member constituencies, 190 seats by party list) 313 seats needed for a majority | ||||||||||||||||||||||||||||||||||||||||||||||||||||||||||||||||||||||||||||||||||||||||||||||||||||||||||||||||||||||||||||||||||||||
|---|---|---|---|---|---|---|---|---|---|---|---|---|---|---|---|---|---|---|---|---|---|---|---|---|---|---|---|---|---|---|---|---|---|---|---|---|---|---|---|---|---|---|---|---|---|---|---|---|---|---|---|---|---|---|---|---|---|---|---|---|---|---|---|---|---|---|---|---|---|---|---|---|---|---|---|---|---|---|---|---|---|---|---|---|---|---|---|---|---|---|---|---|---|---|---|---|---|---|---|---|---|---|---|---|---|---|---|---|---|---|---|---|---|---|---|---|---|---|---|---|---|---|---|---|---|---|---|---|---|---|---|---|---|---|
| Opinion polls | ||||||||||||||||||||||||||||||||||||||||||||||||||||||||||||||||||||||||||||||||||||||||||||||||||||||||||||||||||||||||||||||||||||||
| Turnout | 69.7% | |||||||||||||||||||||||||||||||||||||||||||||||||||||||||||||||||||||||||||||||||||||||||||||||||||||||||||||||||||||||||||||||||||||
| Reporting | as of 12/8/2020 1:06 EST [26] | |||||||||||||||||||||||||||||||||||||||||||||||||||||||||||||||||||||||||||||||||||||||||||||||||||||||||||||||||||||||||||||||||||||
| ||||||||||||||||||||||||||||||||||||||||||||||||||||||||||||||||||||||||||||||||||||||||||||||||||||||||||||||||||||||||||||||||||||||
| ||||||||||||||||||||||||||||||||||||||||||||||||||||||||||||||||||||||||||||||||||||||||||||||||||||||||||||||||||||||||||||||||||||||
| |||||||||||||||||||||||||||||||||||||||||||||||||
All 90 seats in the Wizengamot Commons 326[n 4] seats needed for a majority | |||||||||||||||||||||||||||||||||||||||||||||||||
|---|---|---|---|---|---|---|---|---|---|---|---|---|---|---|---|---|---|---|---|---|---|---|---|---|---|---|---|---|---|---|---|---|---|---|---|---|---|---|---|---|---|---|---|---|---|---|---|---|---|
| Opinion polls | |||||||||||||||||||||||||||||||||||||||||||||||||
| Turnout | 79.9% ( | ||||||||||||||||||||||||||||||||||||||||||||||||
| |||||||||||||||||||||||||||||||||||||||||||||||||
 A map presenting the results of the election, by party of the MP elected from each constituency | |||||||||||||||||||||||||||||||||||||||||||||||||
 Composition of the House of Commons after the election
| |||||||||||||||||||||||||||||||||||||||||||||||||
| |||||||||||||||||||||||||||||||||||||||||||||||||
 The Wankhede During Final | |||||||||
| Event | 2011 Cricket World Cup | ||||||||
|---|---|---|---|---|---|---|---|---|---|
| |||||||||
| India won by 6 wickets | |||||||||
| Date | 2 April 2011 | ||||||||
| Venue | Lord's, City of Westminster, London | ||||||||
| Player of the match | MS Dhoni (Ind)[29] | ||||||||
| Umpires | Aleem Dar (Pak) and Simon Taufel (Aus)[30] | ||||||||
| Attendance | 42,000 | ||||||||
← 2007 2015 → | |||||||||
| |||||||||||||||||||||||||||||||||||||||||||||||||||||||||||||||||||||||||||||||||||||||||||||||||||||||||||||||||||||||
690 seats in the Lok Sabha 345 seats needed for a majority | |||||||||||||||||||||||||||||||||||||||||||||||||||||||||||||||||||||||||||||||||||||||||||||||||||||||||||||||||||||||
|---|---|---|---|---|---|---|---|---|---|---|---|---|---|---|---|---|---|---|---|---|---|---|---|---|---|---|---|---|---|---|---|---|---|---|---|---|---|---|---|---|---|---|---|---|---|---|---|---|---|---|---|---|---|---|---|---|---|---|---|---|---|---|---|---|---|---|---|---|---|---|---|---|---|---|---|---|---|---|---|---|---|---|---|---|---|---|---|---|---|---|---|---|---|---|---|---|---|---|---|---|---|---|---|---|---|---|---|---|---|---|---|---|---|---|---|---|---|---|---|
| Turnout | 44.70% | ||||||||||||||||||||||||||||||||||||||||||||||||||||||||||||||||||||||||||||||||||||||||||||||||||||||||||||||||||||||
| |||||||||||||||||||||||||||||||||||||||||||||||||||||||||||||||||||||||||||||||||||||||||||||||||||||||||||||||||||||||
 | |||||||||||||||||||||||||||||||||||||||||||||||||||||||||||||||||||||||||||||||||||||||||||||||||||||||||||||||||||||||
| |||||||||||||||||||||||||||||||||||||||||||||||||||||||||||||||||||||||||||
636 seats in the House of Representatives 538 Constituency seats | 98 List seats *The month was not known as July at the time 385 seats needed for a majority | |||||||||||||||||||||||||||||||||||||||||||||||||||||||||||||||||||||||||||
|---|---|---|---|---|---|---|---|---|---|---|---|---|---|---|---|---|---|---|---|---|---|---|---|---|---|---|---|---|---|---|---|---|---|---|---|---|---|---|---|---|---|---|---|---|---|---|---|---|---|---|---|---|---|---|---|---|---|---|---|---|---|---|---|---|---|---|---|---|---|---|---|---|---|---|---|
| Turnout | 56.77%, | ||||||||||||||||||||||||||||||||||||||||||||||||||||||||||||||||||||||||||
| |||||||||||||||||||||||||||||||||||||||||||||||||||||||||||||||||||||||||||
| |||||||||||||||||||||||||||||||||||||||||||||||||||||||||||||||||||||||||||
| |||||||||||||||||||||||||||||||||||||||||||||||||||||||||||||||||||||||||||||||||||||||||
636 seats in the House of Representatives 538 Constituency seats | 98 List seats 314 seats needed for a majority | |||||||||||||||||||||||||||||||||||||||||||||||||||||||||||||||||||||||||||||||||||||||||
|---|---|---|---|---|---|---|---|---|---|---|---|---|---|---|---|---|---|---|---|---|---|---|---|---|---|---|---|---|---|---|---|---|---|---|---|---|---|---|---|---|---|---|---|---|---|---|---|---|---|---|---|---|---|---|---|---|---|---|---|---|---|---|---|---|---|---|---|---|---|---|---|---|---|---|---|---|---|---|---|---|---|---|---|---|---|---|---|---|---|
| Turnout | 56.77%, | ||||||||||||||||||||||||||||||||||||||||||||||||||||||||||||||||||||||||||||||||||||||||
| |||||||||||||||||||||||||||||||||||||||||||||||||||||||||||||||||||||||||||||||||||||||||
| |||||||||||||||||||||||||||||||||||||||||||||||||||||||||||||||||||||||||||||||||||||||||
| |||||||||||||||||||||||||||||||||||||||||||||||||||||||||||||||||||||||||||||||||||||
593 seats in the House of Representatives 538 Constituency seats | 55 List seats 270 seats needed for a majority | |||||||||||||||||||||||||||||||||||||||||||||||||||||||||||||||||||||||||||||||||||||
|---|---|---|---|---|---|---|---|---|---|---|---|---|---|---|---|---|---|---|---|---|---|---|---|---|---|---|---|---|---|---|---|---|---|---|---|---|---|---|---|---|---|---|---|---|---|---|---|---|---|---|---|---|---|---|---|---|---|---|---|---|---|---|---|---|---|---|---|---|---|---|---|---|---|---|---|---|---|---|---|---|---|---|---|---|---|
| Turnout | 51.90%, | ||||||||||||||||||||||||||||||||||||||||||||||||||||||||||||||||||||||||||||||||||||
| |||||||||||||||||||||||||||||||||||||||||||||||||||||||||||||||||||||||||||||||||||||
| |||||||||||||||||||||||||||||||||||||||||||||||||||||||||||||||||||||||||||||||||||||
| ||||||||||||||||||||||||||||||||||||||||||||||||||||||||||||||||||||||||||||||||||||||||||||||||||||||||||||||||||||||||||||||||||||||
All 625 seats in the Continental Congress (435 single-member constituencies, 190 seats by party list) 313 seats needed for a majority | ||||||||||||||||||||||||||||||||||||||||||||||||||||||||||||||||||||||||||||||||||||||||||||||||||||||||||||||||||||||||||||||||||||||
|---|---|---|---|---|---|---|---|---|---|---|---|---|---|---|---|---|---|---|---|---|---|---|---|---|---|---|---|---|---|---|---|---|---|---|---|---|---|---|---|---|---|---|---|---|---|---|---|---|---|---|---|---|---|---|---|---|---|---|---|---|---|---|---|---|---|---|---|---|---|---|---|---|---|---|---|---|---|---|---|---|---|---|---|---|---|---|---|---|---|---|---|---|---|---|---|---|---|---|---|---|---|---|---|---|---|---|---|---|---|---|---|---|---|---|---|---|---|---|---|---|---|---|---|---|---|---|---|---|---|---|---|---|---|---|
| Opinion polls | ||||||||||||||||||||||||||||||||||||||||||||||||||||||||||||||||||||||||||||||||||||||||||||||||||||||||||||||||||||||||||||||||||||||
| Turnout | 69.7% | |||||||||||||||||||||||||||||||||||||||||||||||||||||||||||||||||||||||||||||||||||||||||||||||||||||||||||||||||||||||||||||||||||||
| Reporting | as of 12/8/2020 1:06 EST [31] | |||||||||||||||||||||||||||||||||||||||||||||||||||||||||||||||||||||||||||||||||||||||||||||||||||||||||||||||||||||||||||||||||||||
| ||||||||||||||||||||||||||||||||||||||||||||||||||||||||||||||||||||||||||||||||||||||||||||||||||||||||||||||||||||||||||||||||||||||
| ||||||||||||||||||||||||||||||||||||||||||||||||||||||||||||||||||||||||||||||||||||||||||||||||||||||||||||||||||||||||||||||||||||||
| |||||||||||||||||||||||||||||||||||||||||||||||||||||||||||||||||||||||||||||||||||||||||||||||||||||||||||||||||||||||||||||||||||||
538 seats in the House of Representatives 270 seats needed for a majority | |||||||||||||||||||||||||||||||||||||||||||||||||||||||||||||||||||||||||||||||||||||||||||||||||||||||||||||||||||||||||||||||||||||
|---|---|---|---|---|---|---|---|---|---|---|---|---|---|---|---|---|---|---|---|---|---|---|---|---|---|---|---|---|---|---|---|---|---|---|---|---|---|---|---|---|---|---|---|---|---|---|---|---|---|---|---|---|---|---|---|---|---|---|---|---|---|---|---|---|---|---|---|---|---|---|---|---|---|---|---|---|---|---|---|---|---|---|---|---|---|---|---|---|---|---|---|---|---|---|---|---|---|---|---|---|---|---|---|---|---|---|---|---|---|---|---|---|---|---|---|---|---|---|---|---|---|---|---|---|---|---|---|---|---|---|---|---|---|
| Turnout | 56.70%, | ||||||||||||||||||||||||||||||||||||||||||||||||||||||||||||||||||||||||||||||||||||||||||||||||||||||||||||||||||||||||||||||||||||
| |||||||||||||||||||||||||||||||||||||||||||||||||||||||||||||||||||||||||||||||||||||||||||||||||||||||||||||||||||||||||||||||||||||
| |||||||||||||||||||||||||||||||||||||||||||||||||||||||||||||||||||||||||||||||||||||||||||||||||||||||||||||||||||||||||||||||||||||
The 1919 United Provinces General Election was the 35th General Election in American history. It took place one year after the Armistice with Germany was signed, ending American involvement in World War I.
| ||||||||||||||||||||||||||||||||||||||||||||||||||||||||||||||||||||||||||||||||||||||||||||||||||||||||||||||||||||||||||||||||||||||
All 625 seats in the Continental Congress (435 single-member constituencies, 190 seats by party list) 313 seats needed for a majority | ||||||||||||||||||||||||||||||||||||||||||||||||||||||||||||||||||||||||||||||||||||||||||||||||||||||||||||||||||||||||||||||||||||||
|---|---|---|---|---|---|---|---|---|---|---|---|---|---|---|---|---|---|---|---|---|---|---|---|---|---|---|---|---|---|---|---|---|---|---|---|---|---|---|---|---|---|---|---|---|---|---|---|---|---|---|---|---|---|---|---|---|---|---|---|---|---|---|---|---|---|---|---|---|---|---|---|---|---|---|---|---|---|---|---|---|---|---|---|---|---|---|---|---|---|---|---|---|---|---|---|---|---|---|---|---|---|---|---|---|---|---|---|---|---|---|---|---|---|---|---|---|---|---|---|---|---|---|---|---|---|---|---|---|---|---|---|---|---|---|
| Opinion polls | ||||||||||||||||||||||||||||||||||||||||||||||||||||||||||||||||||||||||||||||||||||||||||||||||||||||||||||||||||||||||||||||||||||||
| Turnout | 69.7% | |||||||||||||||||||||||||||||||||||||||||||||||||||||||||||||||||||||||||||||||||||||||||||||||||||||||||||||||||||||||||||||||||||||
| Reporting | as of 12/8/2020 1:06 EST [32] | |||||||||||||||||||||||||||||||||||||||||||||||||||||||||||||||||||||||||||||||||||||||||||||||||||||||||||||||||||||||||||||||||||||
| ||||||||||||||||||||||||||||||||||||||||||||||||||||||||||||||||||||||||||||||||||||||||||||||||||||||||||||||||||||||||||||||||||||||
| ||||||||||||||||||||||||||||||||||||||||||||||||||||||||||||||||||||||||||||||||||||||||||||||||||||||||||||||||||||||||||||||||||||||
While the war was a successf, the aftermath was chaotic, coinciding with the Spanish Flu Pandemic and persecutions of suspected left-wing sympathizers by Home Secretary A. Mitchell Palmer. Leonard Wood, who essentially ran the war abroad along with Wilson, was the incumbent Republican leader after Hughes' resignation but decided to retire at the end of his term. This left the Republican Party fractured, unable to coalesce around a national leader. Some conservatives rallied around popular Governor of Illinois Frank O. Lowden under the "National Republican" label. Tory leader Henry Cabot Lodge won re-nomination by his party. Many Democrats and Republican candidates switched to the rapidly growing Progressive Party, which advocated New Nationalism, buttressed by a strong anti-immigration faction that gained significant support in the West. Many Coalition Progressives failed to receive re-nomination The Democratic Party was also badly divided, split between the pro-Wilson bloc and a more conservative faction led by John W. Davis.
The election was one of the most disruptive in history, auguring the collapse of the Third Party System. The election signaled a clear rejection of the status quo. Republicans kept a plurality of seats but lost critical support among Western voters and some Progressives. The Coalition Democrats lost badly, gaining fewer seats than the Conservatives, resulting in long negotiations that would reunite the party in late 1919. The Tories became the second largest party, and the Progressive Party received the second most votes and became the third largest party the in the House. Coalition Progressives lost nearly all seats, but those who remained largely rejoined the main party. Regional Party performance was mixed. The Texas Republican Party gaining seats for the first time in 20 years, while the California Liberal Party became unrepresented in the House for the first time in 16 years.
While the Republicans were the largest party, they were dysfunctional and unable to choose a leader favored by potential coalition partners. Wilson was able to gather enough coalition support to form a minority government with tacit support from the Progressives, but lost favor and was deposed within a year, replaced by Warren G. Harding until fresh elections took place in November 1921.
The 1921 United Provinces General Election was the 36th General Election in American History. It took place shortly after fresh elections were called by Prime Minister Warren G. Harding, who was ruling as a caretaker due to an inability to form a government. This was the first election in which all women over the age of 21 were granted suffrage. Additionally, 46 List seats were created via proportional representation through the Representation of the People Act 1920.
The election resulted in the the Tory gaining 47 seats, the most among all parties. Tory Leader Henry Cabot Lodge had become popular due to his leadership both domestically and internationally, as well as through being an opponent of Wilson, who was still unpopular at the time. The Progressive Party was plagued by infighting and lost 32 seats. The Socialist Party of America won 10 seats, gaining 6 through the list. Lodge was able to form a coalition government with Republican allies, securing a comfortable majority with Charles Dawes signing on as Deputy Prime Minister. Dawes would assume leadership of the party soon after. Lodge and Dawes were sworn in by President Charles Evans Hughes on 25 November.
This election had the lowest turnout among eligible voters at 51.9%, largely due to low turnout among women.
The 1933 United Provinces General Election the 39th general election in American history. It took place in the midst of the Great Depression, a worldwide economic collapse that resulted in 25% unemployment (maximum estimate), deflation, and reduced wages, meaning widespread poverty.
President Hoover was seen as ineffective, as his policies in the previous 4 years were not enough to change the tide of the Depression. Franklin Delano Roosevelt emerged as Hoover's primary opponent and defeated him and the Republicans in a landslide, winning an outright majority of seats.
The 1936 United States Presidential Election was the 40th general election in American history. I
| |||||||||||||||||||||||||||||||||||||||||||||||||||||||||||||
538 seats in the House of Representatives 270 seats needed for a majority | |||||||||||||||||||||||||||||||||||||||||||||||||||||||||||||
|---|---|---|---|---|---|---|---|---|---|---|---|---|---|---|---|---|---|---|---|---|---|---|---|---|---|---|---|---|---|---|---|---|---|---|---|---|---|---|---|---|---|---|---|---|---|---|---|---|---|---|---|---|---|---|---|---|---|---|---|---|---|
| Turnout | 62.70% | ||||||||||||||||||||||||||||||||||||||||||||||||||||||||||||
| |||||||||||||||||||||||||||||||||||||||||||||||||||||||||||||
| |||||||||||||||||||||||||||||||||||||||||||||||||||||||||||||
| |||||||||||||||||||||||||||||||||||||||||||||||||||||||||||||||
538 members of the Electoral College 270 electoral votes needed to win | |||||||||||||||||||||||||||||||||||||||||||||||||||||||||||||||
|---|---|---|---|---|---|---|---|---|---|---|---|---|---|---|---|---|---|---|---|---|---|---|---|---|---|---|---|---|---|---|---|---|---|---|---|---|---|---|---|---|---|---|---|---|---|---|---|---|---|---|---|---|---|---|---|---|---|---|---|---|---|---|---|
| Opinion polls | |||||||||||||||||||||||||||||||||||||||||||||||||||||||||||||||
| |||||||||||||||||||||||||||||||||||||||||||||||||||||||||||||||
 2024 electoral map, based on 2020 census | |||||||||||||||||||||||||||||||||||||||||||||||||||||||||||||||
| |||||||||||||||||||||||||||||||||||||||||||||||||||||||||||||||
| World War III | |||||||||
|---|---|---|---|---|---|---|---|---|---|
 | |||||||||
| Belligerents | |||||||||
|
Supported by: |
| ||||||||
| Commanders and leaders | |||||||||
| Strength | |||||||||
|
Total: 673,900 |
Total: 889,000[34] 888,000 mobilised 324,478 deployed | ||||||||
| Casualties and losses | |||||||||
|
Total: 165,363 dead |
Total: 450,015 dead[35][34] 73,125 combat deaths 376,890 non-combat deaths | ||||||||
| Casualties include death by disease. In all cases, death by disease exceeded the sum of "killed in action" or "died of wounds". | |||||||||
 Staples Center, hours before the game | |||||||||||
| |||||||||||
| Date | June 17, 2010 | ||||||||||
|---|---|---|---|---|---|---|---|---|---|---|---|
| Venue | Staples Center, Los Angeles, California | ||||||||||
| Favorite | Lakers by 7 | ||||||||||
| Referees | Joey Crawford, Dan Crawford, Scott Foster | ||||||||||
| Attendance | 18,997 | ||||||||||
| Network | ABC | ||||||||||
| Announcers | Mike Breen, Mark Jackson, Jeff Van Gundy, and Lisa Salters | ||||||||||
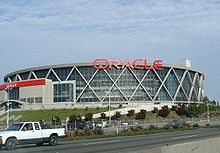 Oracle Arena, site of the game | |||||||||||
| |||||||||||
| Date | June 19, 2016 | ||||||||||
|---|---|---|---|---|---|---|---|---|---|---|---|
| Venue | Oracle Arena, Oakland, California | ||||||||||
| Favorite | Warriors by 4.5 | ||||||||||
| Referees | Mike Callahan, Dan Crawford, Monty McCutchen | ||||||||||
| Attendance | 19,596 | ||||||||||
| Network | ABC | ||||||||||
| Announcers | Mike Breen, Mark Jackson, Jeff Van Gundy, and Lisa Salters | ||||||||||
| Administrative division | Capital | Population |
|---|---|---|
| Quetta | 12,344,408 | |
| Lahore | 110,126,285 | |
| Karachi | 47,886,051 | |
| Peshawar | 40,525,047 | |
| Gilgit | 1,800,000 | |
| Muzaffarabad | 4,567,982 | |
| Islamabad Capital Territory | Islamabad | 2,851,868 |
| |||||||||||||||||||||||||||||||||||||||||||||||||||||||||||||||||||||
600 seats in the Lok Sabha 345 seats needed for a majority | |||||||||||||||||||||||||||||||||||||||||||||||||||||||||||||||||||||
|---|---|---|---|---|---|---|---|---|---|---|---|---|---|---|---|---|---|---|---|---|---|---|---|---|---|---|---|---|---|---|---|---|---|---|---|---|---|---|---|---|---|---|---|---|---|---|---|---|---|---|---|---|---|---|---|---|---|---|---|---|---|---|---|---|---|---|---|---|---|
| Turnout | 44.70% | ||||||||||||||||||||||||||||||||||||||||||||||||||||||||||||||||||||
| |||||||||||||||||||||||||||||||||||||||||||||||||||||||||||||||||||||
 | |||||||||||||||||||||||||||||||||||||||||||||||||||||||||||||||||||||
| |||||||||||||||||||||||||||||
102 seats contested 52 seats needed for a majority | |||||||||||||||||||||||||||||
|---|---|---|---|---|---|---|---|---|---|---|---|---|---|---|---|---|---|---|---|---|---|---|---|---|---|---|---|---|---|
| |||||||||||||||||||||||||||||
 | |||||||||||||||||||||||||||||
US 101 highlighted in red | ||||
| Route information | ||||
| Maintained by Caltrans | ||||
| Length | 808.111 mi[36] (1,300.529 km) Portions of US 101 have been relinquished to or are otherwise maintained by local or other governments, and are not included in the length. | |||
| Existed | November 11, 1926[37][38]–present | |||
| Tourist routes |
| |||
| NHS | Entire route | |||
| Major junctions | ||||
| South end | ||||
| ||||
| North end | ||||
| Location | ||||
| Country | United States | |||
| Counties | Los Angeles, Ventura, Santa Barbara, San Luis Obispo, Monterey, San Benito, Santa Clara, San Mateo, San Francisco, Marin, Sonoma, Mendocino, Humboldt, Del Norte | |||
| Highway system | ||||
| ||||
| |||||||||||||||||||||||||||||||||||||
538 members of the Electoral College 270 electoral votes needed to win | |||||||||||||||||||||||||||||||||||||
|---|---|---|---|---|---|---|---|---|---|---|---|---|---|---|---|---|---|---|---|---|---|---|---|---|---|---|---|---|---|---|---|---|---|---|---|---|---|
| Opinion polls | |||||||||||||||||||||||||||||||||||||
| Turnout | 58.9%[41] | ||||||||||||||||||||||||||||||||||||
| |||||||||||||||||||||||||||||||||||||
 Presidential election results map. Blue denotes states won by Obama/Biden and red denotes those won by Romney/Ryan. Numbers indicate electoral votes cast by each state and the District of Columbia. | |||||||||||||||||||||||||||||||||||||
| |||||||||||||||||||||||||||||||||||||
Federal Union of India | |||||||||
|---|---|---|---|---|---|---|---|---|---|
| 1948–1956 | |||||||||
![Administrative divisions of India, 1949[g]](http://upload.wikimedia.org/wikipedia/commons/thumb/b/b1/India_Administrative_Divisions_1949-Kashmir.jpg/250px-India_Administrative_Divisions_1949-Kashmir.jpg) Administrative divisions of India, 1949[g] | |||||||||
| Capital | Calcutta | ||||||||
| Official languages | English, Hindustani | ||||||||
| Recognised national languages | None | ||||||||
| Recognised regional languages | Urdu | ||||||||
| Common languages | Hindi, Urdu, Bengali, Punjabi, Telugu, Marathi, Tamil | ||||||||
| Demonym(s) | Indian, Desi, Hindustani, Sindhu | ||||||||
| Monarch | |||||||||
• 1947–1950 | George VI | ||||||||
| Governor-General | |||||||||
• 1947–1948 | Lord Mountbatten | ||||||||
• 1948–1950 | Chakravarti Rajagopalachari | ||||||||
| Prime Minister | |||||||||
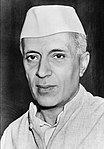
• 1947–1950 | Jawaharlal Nehru[43] | ||||||||
| Legislature | Constituent Assembly | ||||||||
| History | |||||||||
| 15 August 1948 | |||||||||
• Republic | 26 January 1956 | ||||||||
| Area | |||||||||
| 1949–1950 | 3,159,814[44] km2 (1,220,011 sq mi) | ||||||||
| Population | |||||||||
• 1949–1950 | 360,185,000 (estimated)[44] | ||||||||
| Currency | Indian rupee | ||||||||
| |||||||||
| Today part of | India China[h] Bangladesh[i] | ||||||||
Union of California | |||||||||||||
|---|---|---|---|---|---|---|---|---|---|---|---|---|---|
| 1870-1920 | |||||||||||||
| Motto: Liberty, Equality, Fraternity | |||||||||||||
| Anthem: "I Love You, California" | |||||||||||||
 Mexico's Department of Alta California, of which the coastline and Mojave Desert were controlled by the Republican Government | |||||||||||||
| Status | Sovereign state (1876-1920) | ||||||||||||
| Capital | Vallejo (1870-1876)
Sacramento (1876-1900) San Jose (1900-1920) | ||||||||||||
| Official languages | English Spanish (from 1896) | ||||||||||||
| Recognised national languages | None | ||||||||||||
| Common languages | Spanish, indigenous languages, and English | ||||||||||||
| Demonym(s) | Californian | ||||||||||||
| Government | Military Government (1870-1876)
| ||||||||||||
| President | |||||||||||||
• 1871-1879 | John C. Frémont | ||||||||||||
| Population | |||||||||||||
• 1870 | 800,000 | ||||||||||||
• 1920 | 5,200,000 | ||||||||||||
| |||||||||||||
Union of New England and Atlantic Provinces (1833-1837) United Provinces of North America (1837–1871) | |||||||||||||||||||||||
|---|---|---|---|---|---|---|---|---|---|---|---|---|---|---|---|---|---|---|---|---|---|---|---|
| 1833–1871 | |||||||||||||||||||||||
| Motto: {{center|”E Pluribus Unum”} | |||||||||||||||||||||||
 Map of the UPNA in 1833 | |||||||||||||||||||||||
| Capital |
| ||||||||||||||||||||||
| Official languages | English | ||||||||||||||||||||||
| Other languages | Dutch, French, German, Iroquoian Languages, Algonquian Languages, Massachusett, Other Indigenous Languages | ||||||||||||||||||||||
| Government | Federal parliamentary constitutional monarchy | ||||||||||||||||||||||
| President1</sup | |||||||||||||||||||||||
• 1836 | David G. Burnet | ||||||||||||||||||||||
• 1836–38 | Sam Houston, 1st term | ||||||||||||||||||||||
• 1838–41 | Mirabeau B. Lamar | ||||||||||||||||||||||
• 1841–44 | Sam Houston, 2nd term | ||||||||||||||||||||||
• 1844–46 | Anson Jones | ||||||||||||||||||||||
| Vice President1 | |||||||||||||||||||||||
• 1836 | Lorenzo de Zavala | ||||||||||||||||||||||
• 1836–38 | Mirabeau B. Lamar | ||||||||||||||||||||||
• 1838–41 | David G. Burnet | ||||||||||||||||||||||
• 1841–44 | Edward Burleson | ||||||||||||||||||||||
• 1844–45 | Kenneth L. Anderson | ||||||||||||||||||||||
| Legislature | Continental Congress | ||||||||||||||||||||||
| Historical era | Western Expansion | ||||||||||||||||||||||
| March 4, 1833 | |||||||||||||||||||||||
| December 29, 1845 | |||||||||||||||||||||||
• Transfer of power | March 4, 1871 | ||||||||||||||||||||||
| Currency | Texas dollar | ||||||||||||||||||||||
| |||||||||||||||||||||||
| Today part of | |||||||||||||||||||||||
1Interim period (March 16 – October 22, 1836): President: David G. Burnet, Vice President Lorenzo de Zavala | |||||||||||||||||||||||
Presidency of Canada and the Great Lakes | |||||||||||||||
|---|---|---|---|---|---|---|---|---|---|---|---|---|---|---|---|
| 1791–1870 | |||||||||||||||
| Motto: Nunquam libertas gratior extat (Latin) Nowhere does liberty appear in a greater form (English) | |||||||||||||||
| Anthem: "God Save the King" | |||||||||||||||
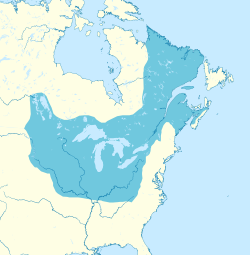 Map of the Dominion, represented in dark red, as of 1688. Names of the constituent and neighboring colonies also shown. | |||||||||||||||
| Status | Disestablished | ||||||||||||||
| Capital | Niagara {1791-1797) York (1797-1850) Toronto (1850-) | ||||||||||||||
| Largest city | Chicago | ||||||||||||||
| Common languages | English, French, Iroquoian, Algonquian | ||||||||||||||
| Government | Direct rule colonial government (1791-97)
Family Compact Oligarchy (1797-1833) Responsible Government under a Constitutional Monarchy (1833-1867) Provincial Government of The United Provinces of America (1867-1870) | ||||||||||||||
| Monarch | |||||||||||||||
• 1791-1820 | George III | ||||||||||||||
• 1820-1830 | George IV | ||||||||||||||
• 1830-1837 | William IV | ||||||||||||||
• 1837-1867 | Victoria | ||||||||||||||
| Royal Governor | |||||||||||||||
• 1686 | Joseph Dudley | ||||||||||||||
• 1686–1689 | Edmund Andros | ||||||||||||||
| Lieutenant Governor | |||||||||||||||
• 1688–1689 | Francis Nicholson | ||||||||||||||
| Legislature | Legislative Council of Canada | ||||||||||||||
| Historical era | British colonization of the Americas Glorious Revolution Colonial History of the United States | ||||||||||||||
• Established | 1791 | ||||||||||||||
• Overthrow of the Family Compact | May 31, 1833 | ||||||||||||||
• Accession into The United Provinces of America | December 31, 1859 | ||||||||||||||
• Disestablished | 1870 | ||||||||||||||
| Currency | Pound sterling | ||||||||||||||
| |||||||||||||||
| Today part of | United States | ||||||||||||||
| Route information | ||||
|---|---|---|---|---|
| Maintained by Caltrans | ||||
| Length | 42.169 mi[36] (67.864 km) | |||
| Existed | 1964[45]–present | |||
| Major junctions | ||||
| West end | ||||
| East end | ||||
| Location | ||||
| Country | United States | |||
| State | California | |||
| Counties | San Mateo, Alameda | |||
| Highway system | ||||
| ||||
Province of Canada Province du Canada (French) | |||||||||||||||
|---|---|---|---|---|---|---|---|---|---|---|---|---|---|---|---|
| 1841–1867 | |||||||||||||||
| Status | British colony | ||||||||||||||
| Capital | Kingston 1841–44 Montréal 1844–49 Toronto 1849–1852, 1856–1858 Quebec City 1852–56, 1859–1866 Ottawa 1866–67 | ||||||||||||||
| Common languages | English, French | ||||||||||||||
| Government | Responsible government under a constitutional monarchy | ||||||||||||||
| Monarch | |||||||||||||||
• 1841-1867 | Queen Victoria | ||||||||||||||
| Governor General | |||||||||||||||
• 1841 | Charles Poulett Thomson, 1st Baron Sydenham | ||||||||||||||
• 1861-1867 | Charles Monck, 4th Viscount Monck | ||||||||||||||
| Premier | |||||||||||||||
• 1841-1842 | Samuel Harrison | ||||||||||||||
• 1865-1867 | Narcisse-Fortunat Belleau | ||||||||||||||
| Legislature | Parliament of the Province of Canada | ||||||||||||||
| Historical era | Pre-Confederation era | ||||||||||||||
| 10 February 1841 | |||||||||||||||
| 11 March 1848 | |||||||||||||||
| 1 July 1867 | |||||||||||||||
| Population | |||||||||||||||
• 1860–61 | 2,507,657 | ||||||||||||||
| Currency | Canadian pound 1841–58 Canadian dollar 1858–67 | ||||||||||||||
| |||||||||||||||
| Route information | ||||
|---|---|---|---|---|
| Maintained by Caltrans | ||||
| Length | 43.4 mi[36] (69.8 km) | |||
| Existed | 1964[45]–present | |||
| Major junctions | ||||
| West end | ||||
| East end | ||||
| Location | ||||
| Country | United States | |||
| State | California | |||
| Counties | San Mateo, Alameda | |||
| Highway system | ||||
| ||||
| ||||||||||||||||||||||||||||||||||||||||||||||||||||||||||||||||
All 650 seats in the House of Commons | ||||||||||||||||||||||||||||||||||||||||||||||||||||||||||||||||
|---|---|---|---|---|---|---|---|---|---|---|---|---|---|---|---|---|---|---|---|---|---|---|---|---|---|---|---|---|---|---|---|---|---|---|---|---|---|---|---|---|---|---|---|---|---|---|---|---|---|---|---|---|---|---|---|---|---|---|---|---|---|---|---|---|
| Turnout | 69.42% | |||||||||||||||||||||||||||||||||||||||||||||||||||||||||||||||
| ||||||||||||||||||||||||||||||||||||||||||||||||||||||||||||||||
| 32 | March 4, 1933–
April 12, 1945 |
|
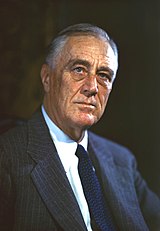
Franklin D. Roosevelt[l] | Democratic | 1932 | John Nance Garner | |
|---|---|---|---|---|---|---|---|
| 1936 | |||||||
| 1940 | Henry A. Wallace | ||||||
| 1944 | Harry S. Truman | ||||||
| 33 | April 12, 1945–
January 20, 1953 |

|
Harry S. Truman | Democratic | |||
| 1948 | Alben W. Barkley | ||||||
| 34 | January 20, 1953–
January 20, 1957 |

|
Robert Taft | Republican | 1952 | Adlai Stevenson | |
| 35 | January 20, 1957–
January 20, 1965 |

|
Dwight D. Eisenhower | Independent | 1956 | John Lindsay | |
| 1960 | |||||||
| 36 | January 20, 1965–
November 22, 1967 |

|
John F. Kennedy | Democratic | 1964 | Lyndon B. Johnson | |
| 37 | November 22, 1967–
January 20, 1973 |
|
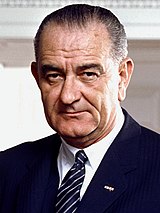
Lyndon B. Johnson | Democratic | 1968 | Hubert Humphrey | |
| 38 | January 20, 1973–
January 20, 1977 |

|
Walter Mondale | Democratic | 1972 | George Romney | |
| 1976 | |||||||
| 39 | January 20, 1977–
January 20, 1981 |

|
Ronald Reagan | Independent | 1977 | Gerald Ford | |
| 40 | January 20, 1981–
January 20, 1989 |
George Bush | Republican | ||||
| 41 | 4 August 1992 - 19 November 1999 | Bill Clinton | Republican | ||||
| 42 | November 20, 1999- 3 March 2004 | Al Gore | Independent | ||||
| 44 | December 3, 2004– 3 March 2009 | John McCain | Mitt Romney | ||||
| 45 | 4 March 2009- 8 July 2016 | Barack Obama | The Republic Onward! | Hillary Clinton | |||
| 46 | 8 July 2016 - 17 December 2017 | Hillary Clinton | Renew America | ||||
| 47 | 17 December 2017 - 6 January 2021 | Donald Trump | National Peoples' Party | ||||
| 48 | 7 January 2021 - 18 July 2024 | Joe Biden | Liberal | ||||
| 49 | 18 July 2024- 17 January 2027 | Kamala Harris | Liberal |
| Company type | Private |
|---|---|
| Industry | Paper |
| Founded | 1949 |
| Founder | Robert Dunder Robert Mifflin |
Key people | David Wallace, Former CFO, Current CEO Alan Brand, former CEO Michael Scott, VP, Northeast Region Dwight Schrute, Manager, Scranton Branch |
| Owner | David Wallace |
| Parent | Sabre Corp. (2010-2012) |
| Formerly | Athlead |
|---|---|
| Company type | Private |
| Industry | Sports Marketing |
| Founded | 2012 |
| Founder | Jim Halpert and Friends |
| Defunct | December 9, 2018 |
| Headquarters | Philadelphia, Pennsylvania |
Key people | Darryl Philbin, VP of Athlete Relations |
| Owner | David Wallace |
| Parent | Sabre Corp. (2010-2012) |
- ^ "Archived copy". Archived from the original on 5 July 2024. Retrieved 5 July 2024.
{{cite web}}: CS1 maint: archived copy as title (link) - ^ "About the Democratic Party". Democratic Party. Archived from the original on April 6, 2022. Retrieved April 15, 2022.
For 171 years, [the Democratic National Committee] has been responsible for governing the Democratic Party
- ^ Democratic Party (March 12, 2022). "The Charter & The Bylaws of the Democratic Party of the United States" (PDF). p. 3. Archived (PDF) from the original on March 27, 2022. Retrieved April 15, 2022.
The Democratic National Committee shall have general responsibility for the affairs of the Democratic Party between National Conventions
- ^ Cole, Donald B. (1970). Jacksonian Democracy in New Hampshire, 1800–1851. Harvard University Press. p. 69. ISBN 978-0-67-428368-8.
- ^ Bacon, Perry Jr. (March 11, 2019). "The Six Wings Of The Democratic Party". FiveThirtyEight. Archived from the original on August 15, 2021. Retrieved October 21, 2021.
- ^ Stein, Letita; Cornwell, Susan; Tanfani, Joseph (August 23, 2018). "Inside the progressive movement roiling the Democratic Party". Reuters. Archived from the original on June 13, 2022. Retrieved June 13, 2022.
- ^ Rae, Nicol C. (June 2007). "Be Careful What You Wish For: The Rise of Responsible Parties in American National Politics". Annual Review of Political Science. 10 (1). Annual Reviews: 169–191. doi:10.1146/annurev.polisci.10.071105.100750. ISSN 1094-2939.
What are we to make of American parties at the dawn of the twenty-first century? ... The impact of the 1960s civil rights revolution has been to create two more ideologically coherent parties: a generally liberal or center-left party and a conservative party.
- ^ Marantz, Andrew (May 24, 2021). "Are We Entering a New Political Era?". The New Yorker. New York, New York: Condé Nast. Archived from the original on April 19, 2024. Retrieved June 16, 2024.
Moderation may be relative, but moderates still run the Democratic Party.
- ^ Bruner, Christopher M. (2018). "Center-Left Politics and Corporate Governance: What Is the 'Progressive' Agenda?". BYU Law Review. 2018 (2). Digital Commons: 267–334. doi:10.2139/ssrn.2917253. ISSN 2162-8572. SSRN 2917253.
This article has argued that a widespread and fundamental reorientation of the Democratic Party toward decidedly centrist national politics over recent decades fundamentally altered the role of corporate governance, and related issues, in the project of assembling a competitive electoral coalition.
- ^ Coates, David, ed. (2012). "The Oxford Companion to American Politics". Liberalism, Center-left. The Oxford Companion to American Politics. Oxford University Press. pp. 68–69. doi:10.1093/acref/9780199764310.001.0001. ISBN 978-0-19-976431-0.
Observes that the terms "progressive" and "liberal" are "often used interchangeably" in political discourse regarding "the center-left".
- ^ Cronin, James E.; Ross, George W.; Shoch, James (August 24, 2011). "Introduction: The New World of the Center-Left". What's Left of the Left: Democrats and Social Democrats in Challenging Times. Duke University Press. ISBN 978-0-8223-5079-8. pp. 17, 22, 182:
Including the American Democratic Party in a comparative analysis of center-left parties is unorthodox, since unlike Europe, America has not produced a socialist movement tied to a strong union movement. Yet the Democrats may have become center-left before anyone else, obliged by their different historical trajectory to build complex alliances with social groups other than the working class and to deal with unusually powerful capitalists ... Taken together, the three chapters devoted to the United States show that the center-left in America faces much the same set of problems as elsewhere and, especially in light of the election results from 2008, that the Democratic Party's potential to win elections, despite its current slide in approval, may be at least equal to that of any center-left party in Europe ... Despite the setback in the 2010 midterms, together the foregoing trends have put the Democrats in a position to eventually build a dominant center-left majority in the United States.
- ^ Hacker, Jacob S.; Malpas, Amelia; Pierson, Paul; Zacher, Sam (December 27, 2023). "Bridging the Blue Divide: The Democrats' New Metro Coalition and the Unexpected Prominence of Redistribution". Perspectives on Politics. Cambridge University Press on behalf of the American Political Science Association: 3. doi:10.1017/S1537592723002931. ISSN 1537-5927.
We conclude by considering why Democrats have taken this course, why they are not perceived as having done so, and why, at this fraught juncture for American democratic capitalism, political scientists could learn much from closer examination of the rich world's largest center-left party.
- ^ Cite error: The named reference
Polarized by Degreeswas invoked but never defined (see the help page). - ^ "Archived copy". Archived from the original on 5 July 2024. Retrieved 5 July 2024.
{{cite web}}: CS1 maint: archived copy as title (link) - ^ "Archived copy". Archived from the original on 5 July 2024. Retrieved 5 July 2024.
{{cite web}}: CS1 maint: archived copy as title (link) - ^ "Archived copy". Archived from the original on 5 July 2024. Retrieved 5 July 2024.
{{cite web}}: CS1 maint: archived copy as title (link) - ^ "Government majority". Institute for Government. 20 December 2019. Archived from the original on 28 November 2022. Retrieved 4 July 2024.
- ^ "General Election 2024". Sky News. Archived from the original on 5 July 2024. Retrieved 5 July 2024.
- ^ "Archived copy". Archived from the original on 5 July 2024. Retrieved 5 July 2024.
{{cite web}}: CS1 maint: archived copy as title (link) - ^ "Archived copy". Archived from the original on 5 July 2024. Retrieved 5 July 2024.
{{cite web}}: CS1 maint: archived copy as title (link) - ^ "Full Scorecard of Sri Lanka vs India Final 2010/11 - Score Report". ESPNcricinfo. Retrieved 19 November 2021.
- ^ "India v Sri Lanka: Taufal and Dar to umpire World Cup Final". ESPNcricinfo. 31 March 2011. Retrieved 2 April 2011.
- ^ "Archived copy". Archived from the original on 5 July 2024. Retrieved 5 July 2024.
{{cite web}}: CS1 maint: archived copy as title (link) - ^ "Archived copy". Archived from the original on 5 July 2024. Retrieved 5 July 2024.
{{cite web}}: CS1 maint: archived copy as title (link) - ^ "Archived copy". Archived from the original on 5 July 2024. Retrieved 5 July 2024.
{{cite web}}: CS1 maint: archived copy as title (link) - ^ "Archived copy". Archived from the original on 5 July 2024. Retrieved 5 July 2024.
{{cite web}}: CS1 maint: archived copy as title (link) - ^ "Government majority". Institute for Government. 20 December 2019. Archived from the original on 28 November 2022. Retrieved 4 July 2024.
- ^ "General Election 2024". Sky News. Archived from the original on 5 July 2024. Retrieved 5 July 2024.
- ^ "Full Scorecard of Sri Lanka vs India Final 2010/11 - Score Report". ESPNcricinfo. Retrieved 19 November 2021.
- ^ "India v Sri Lanka: Taufal and Dar to umpire World Cup Final". ESPNcricinfo. 31 March 2011. Retrieved 2 April 2011.
- ^ "Archived copy". Archived from the original on 5 July 2024. Retrieved 5 July 2024.
{{cite web}}: CS1 maint: archived copy as title (link) - ^ "Archived copy". Archived from the original on 5 July 2024. Retrieved 5 July 2024.
{{cite web}}: CS1 maint: archived copy as title (link) - ^ Badem 2010, p. 180.
- ^ a b c d e f g h i Clodfelter 2017, p. 180.
- ^ Mara Kozelsky, "The Crimean War, 1853–56." Kritika: Explorations in Russian and Eurasian History 13.4 (2012): 903–917 online.
- ^ a b c Cite error: The named reference
trucklistwas invoked but never defined (see the help page). - ^ McNichol, Dan (2006). The Roads that Built America: The Incredible Story of the US Interstate System. New York: Sterling. p. 74. ISBN 1-4027-3468-9.
- ^ Bureau of Public Roads & American Association of State Highway Officials (November 11, 1926). United States System of Highways Adopted for Uniform Marking by the American Association of State Highway Officials (Map). 1:7,000,000. Washington, DC: United States Geological Survey. OCLC 32889555. Retrieved November 7, 2013 – via Wikimedia Commons.
- ^ Cite error: The named reference
KEYTwas invoked but never defined (see the help page). - ^ Cite error: The named reference
caltransscenicwas invoked but never defined (see the help page). - ^ a b c Cite error: The named reference
FEC 2013was invoked but never defined (see the help page). - ^ "Press Communique' – State Emblem" (PDF). Press Information Bureau of India – Archive. Archived (PDF) from the original on 24 February 2018.
{{cite web}}:|archive-date=/|archive-url=timestamp mismatch; 8 August 2017 suggested (help) - ^ As Prime Minister of India until 1964.
- ^ a b S. H. Steinberg, ed. (1950), The Statesman's Year-Book, 1950, London: Macmillan and Co., Ltd, p. 137
- ^ a b Faigin, Daniel P. "County Highways - State Route 92". www.cahighways.org. Retrieved 2008-07-21.
- ^ According to the Manifesto Project Database MARPOR dataset for 2020, the Democratic Party has a RILE score of -24.662, putting it within the range of being a center to center-left party. Historically, it has classified the party as centrist or center-right, but the database has noted a relatively recent shift to the left in the party's politics.
- ^ [7][8][9][10][11][12][13][a]
- ^ There are 47 senators who are members of the party; however, four independent senators, Angus King, Bernie Sanders, Joe Manchin III, and Kyrsten Sinema caucus with the Democrats, effectively giving the Democrats a 51–49 majority.
- ^ From 2027
- ^ Until 1855
- ^ Until 1854
- ^ The northern border of India was not precisely defined until 1954.
- ^ See Sino-Indian War of 1962.
- ^ See territorial exchanges between India and Bangladesh (India–Bangladesh enclaves).
- ^ Princely States
- ^ Incorporated to the Sumatra Governorate in 1938
- ^ Cite error: The named reference
diednaturalwas invoked but never defined (see the help page).
| This is the sandbox page for User:Sillygoose762 (diff). |
- ^ a b c d e f g h i Farage did not have a seat in Parliament prior to the election, but stood in this constituency and won.
- ^ Given that Sinn Féin members of Parliament (MPs) practise abstentionism and do not take their seats, while the Speaker and deputies do not vote, the number of MPs needed for a majority is in practice slightly lower.[17] Sinn Féin won seven seats, and including the speaker and their three deputy speakers, meaning a practical majority requires 320 seats.
- ^ a b c d e f g John Swinney sits in the Scottish Parliament for Perthshire North. Stephen Flynn, MP for Aberdeen South, is the SNP leader at Westminster.
- ^ Given that Sinn Féin members of Parliament (MPs) practise abstentionism and do not take their seats, while the Speaker and deputies do not vote, the number of MPs needed for a majority is in practice slightly lower.[27] Sinn Féin won seven seats, and including the speaker and their three deputy speakers, meaning a practical majority requires 320 seats.








![Emblem[42] of Sillygoose762/sandbox](http://upload.wikimedia.org/wikipedia/commons/thumb/d/db/Emblem_of_India_%28without_motto%29.svg/60px-Emblem_of_India_%28without_motto%29.svg.png)


