1956 Japanese House of Councillors election
| |||||||||||||||||||||||||||||||||||||||||||||||||||||||||||
127 of the 250 seats in the House of Councillors 126 seats needed for a majority | |||||||||||||||||||||||||||||||||||||||||||||||||||||||||||
|---|---|---|---|---|---|---|---|---|---|---|---|---|---|---|---|---|---|---|---|---|---|---|---|---|---|---|---|---|---|---|---|---|---|---|---|---|---|---|---|---|---|---|---|---|---|---|---|---|---|---|---|---|---|---|---|---|---|---|---|
| |||||||||||||||||||||||||||||||||||||||||||||||||||||||||||
| |||||||||||||||||||||||||||||||||||||||||||||||||||||||||||
| This article is part of a series on |
 |
|---|
|
|
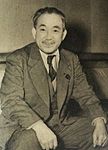
House of Councillors elections were held in Japan on 8 July 1956,[1] electing half the seats in the House plus two vacant seats in the other half. The Liberal Democratic Party won the most seats, but failed to win a majority. It was the first national election under the 1955 System, approximately a two party system of Ichirō Hatoyama's Liberal Democratic Party (LDP) that was created in the "conservative merger" of 1955 and Suzuki Mosaburō's reunified Japan Socialist Party (JSP). The later dominant LDP failed to win a majority.
A key campaign issue was Prime Minister Ichirō Hatoyama's plan to revise Article 9 of the constitution – any change of the constitution requires a two-thirds majority in both chambers of the Diet. The left parties aimed to win at least a third of seats to prevent any constitutional change. Another issue was the government's plan to replace the elected prefectural boards of education with appointed ones, a plan fiercely opposed by the left: In June 1956, on the LDP's request the police intervened in the "deliberations" in the Diet when Socialist Councillors resorted to violence.
Results
[edit]Two by-elections for the class of Councillors elected in 1953 were held simultaneously: The candidates with the 51st and 52nd highest vote shares in the national vote (one Socialist and one Liberal Democrat) were elected for three-year terms. Takenaka Tsuneo, who was elected as a member of the Japan Dentists' Federation, later joined the LDP.
 | ||||||||||||
|---|---|---|---|---|---|---|---|---|---|---|---|---|
| Party | National | Constituency | Seats | |||||||||
| Votes | % | Seats | Votes | % | Seats | Not up | Won | Total after | +/– | |||
| Liberal Democratic Party | 11,356,874 | 39.69 | 19 | 14,353,960 | 48.35 | 42 | 61 | 61 | 122 | New | ||
| Japan Socialist Party | 8,549,940 | 29.88 | 21 | 11,156,060 | 37.58 | 28 | 31 | 49 | 80 | New | ||
| Ryokufūkai | 2,877,102 | 10.05 | 5 | 653,843 | 2.20 | 0 | 26 | 5 | 31 | –3 | ||
| Japanese Communist Party | 599,254 | 2.09 | 1 | 1,149,009 | 3.87 | 1 | 0 | 2 | 2 | +1 | ||
| Labourers and Farmers Party | 181,524 | 0.63 | 0 | 120,414 | 0.41 | 0 | 0 | 0 | 0 | –2 | ||
| Other parties | 607,832 | 2.12 | 1 | 115,862 | 0.39 | 0 | 0 | 1 | 1 | 0 | ||
| Independents | 4,443,886 | 15.53 | 5 | 2,136,498 | 7.20 | 4 | 5 | 9 | 14 | –22 | ||
| Total | 28,616,412 | 100.00 | 52 | 29,685,646 | 100.00 | 75 | 123 | 127 | 250 | 0 | ||
| Valid votes | 28,616,412 | 91.83 | 29,685,646 | 95.25 | ||||||||
| Invalid/blank votes | 2,545,797 | 8.17 | 1,479,521 | 4.75 | ||||||||
| Total votes | 31,162,209 | 100.00 | 31,165,167 | 100.00 | ||||||||
| Registered voters/turnout | 50,177,888 | 62.10 | 50,177,888 | 62.11 | ||||||||
| Source: Ministry of Internal Affairs and Communications,[1][2] National Diet | ||||||||||||
By constituency
[edit]| Prefecture | Total seats |
Seats won | |||||
|---|---|---|---|---|---|---|---|
| LDP | JSP | Ryokufūkai | JCP | Others | Ind. | ||
| Aichi | 3 | 2 | 1 | ||||
| Akita | 1 | 1 | |||||
| Aomori | 1 | 1 | |||||
| Chiba | 2 | 1 | 1 | ||||
| Ehime | 1 | 1 | |||||
| Fukui | 1 | 1 | |||||
| Fukuoka | 3 | 1 | 2 | ||||
| Fukushima | 2 | 1 | 1 | ||||
| Gifu | 1 | 1 | |||||
| Gunma | 2 | 1 | 1 | ||||
| Hiroshima | 2 | 1 | 1 | ||||
| Hokkaido | 4 | 2 | 2 | ||||
| Hyōgo | 3 | 2 | 1 | ||||
| Ibaraki | 2 | 1 | 1 | ||||
| Ishikawa | 1 | 1 | |||||
| Iwate | 1 | 1 | |||||
| Kagawa | 1 | 1 | |||||
| Kagoshima | 2 | 1 | 1 | ||||
| Kanagawa | 2 | 2 | |||||
| Kōchi | 1 | 1 | |||||
| Kumamoto | 2 | 1 | 1 | ||||
| Kyoto | 2 | 1 | 1 | ||||
| Mie | 1 | 1 | |||||
| Miyagi | 1 | 1 | |||||
| Miyazaki | 1 | 1 | |||||
| Nagano | 2 | 1 | 1 | ||||
| Nagasaki | 1 | 1 | |||||
| Nara | 1 | 1 | |||||
| Niigata | 2 | 1 | 1 | ||||
| Ōita | 1 | 1 | |||||
| Okayama | 2 | 1 | 1 | ||||
| Osaka | 3 | 1 | 1 | 1 | |||
| Saga | 1 | 1 | |||||
| Saitama | 2 | 2 | |||||
| Shiga | 1 | 1 | |||||
| Shimane | 1 | 1 | |||||
| Shizuoka | 2 | 1 | 1 | ||||
| Tochigi | 2 | 1 | 1 | ||||
| Tokushima | 1 | 1 | |||||
| Tokyo | 4 | 1 | 2 | 1 | |||
| Tottori | 1 | 1 | |||||
| Toyama | 1 | 1 | |||||
| Wakayama | 1 | 1 | |||||
| Yamagata | 1 | 1 | |||||
| Yamaguchi | 1 | 1 | |||||
| Yamanashi | 1 | 1 | |||||
| National | 52 | 19 | 21 | 5 | 1 | 1 | 5 |
| Total | 127 | 61 | 49 | 5 | 2 | 1 | 9 |
See also
[edit]References
[edit]- Time, July 23, 1956: Japan: Swing to the Left
- The Senkyo election archive: Full results of the 1956 Councillors elections by electoral district
- ^ a b Table 13: Persons Elected and Votes Polled by Political Parties - Ordinary Elections for the House of Councillors (1947–2004) Archived 2011-03-23 at the Wayback Machine Ministry of Internal Affairs and Communications
- ^ "27-11 Allotted Number, Candidates, Eligible Voters as of Election Day, Voters and Voting Percentages of Ordinary Elections for the House of Councillors (1947-2004)". Ministry of Internal Affairs and Communications. Archived from the original on 2012-02-20.


