1948 United States presidential election in New Jersey
| ||||||||||||||||||||||||||
| ||||||||||||||||||||||||||
 County Results
| ||||||||||||||||||||||||||
| ||||||||||||||||||||||||||
| Elections in New Jersey |
|---|
 |
The 1948 United States presidential election in New Jersey took place on November 2, 1948. All contemporary 48 states were part of the 1948 United States presidential election. Voters chose 16 electors to the Electoral College, which selected the president and vice president.
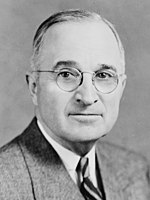
New Jersey was won by the Republican nominees, former Governor Thomas E. Dewey of New York and his running mate Governor Earl Warren of California. Dewey and Warren defeated the Democratic nominees, incumbent President Harry S. Truman of Missouri and his running mate Senator Alben W. Barkley of Kentucky. Also in the running was the Progressive Party candidate, former Democratic Vice President Henry A. Wallace, who ran with former Senator Glen H. Taylor of Idaho.
Dewey carried New Jersey with 50.33% of the vote to Truman's 45.93%, a margin of 4.39%. Wallace came in a distant third, with 2.19%.[1]
Despite the closeness of the statewide result, Dewey won 15 of the state's 21 counties, while Truman won 6. However, Truman won several of the most heavily populated urban counties in the state, taking over 60% of the vote in Hudson County, winning majorities in Mercer, Camden, and Middlesex counties, and in rural Salem County, and winning with a plurality in Passaic County. However, Dewey won majorities in several heavily populated counties, including Bergen, Morris, Union, Monmouth, and Ocean counties, and also narrowly winning Essex County with a plurality, along with winning most of the state's Southern and rural counties. Wallace for his part performed most strongly in North Jersey, particularly in Essex, Union, and Passaic Counties.
New Jersey in this era was usually a swing state with a Republican lean, and its results in 1948 adhered to that pattern. As Truman narrowly defeated Dewey nationally in an upset victory, Dewey's narrow victory in New Jersey made the state almost 9% more Republican than the national average. Republicans won Burlington, Atlantic, Gloucester, and Cumberland counties for the first time since 1932. This is the last time Democrats won the presidency without Essex County.
Primary election
[edit]
| |||||||||||||||||||||||||||||||||||||||||||||||
| |||||||||||||||||||||||||||||||||||||||||||||||
Neither of the major parties held primaries for presidential candidates, but some counties held unofficial nonpartisan primaries. The sums of such elections are shown below. Most votes were Republican candidates, with Thomas E. Dewey and Harold Stassen as the top candidates.
| Party | Candidate | Votes | % | |
|---|---|---|---|---|
| Republican | Thomas E. Dewey | 3,714 | 36.54 | |
| Republican | Harold Stassen | 3,123 | 30.72 | |
| Democratic | Harry S. Truman | 1,100 | 10.82 | |
| Republican | Douglas MacArthur | 718 | 7.06 | |
| Republican | Arthur Vandenberg | 516 | 5.08 | |
| Republican | Robert A. Taft | 495 | 4.87 | |
| Independent | Dwight D. Eisenhower | 288 | 2.83 | |
| Progressive | Henry A. Wallace | 87 | 0.86 | |
| Republican | Joseph W. Martin Jr. | 64 | 0.63 | |
| Republican | Alfred E. Driscoll | 44 | 0.43 | |
| Republican | Earl Warren | 14 | 0.14 | |
| Democratic | Elmer H. Wene | 1 | 0.01 | |
| Democratic | Justice William O. Douglas | 1 | 0.01 | |
| Total votes | 10,165 | 100.0 | ||
Results
[edit]| 1948 United States presidential election in New Jersey | |||||
|---|---|---|---|---|---|
| Party | Candidate | Votes | Percentage | Electoral votes | |
| Republican | Thomas E. Dewey | 981,124 | 50.33% | 16 | |
| Democratic | Harry S. Truman (incumbent) | 895,455 | 45.93% | 0 | |
| Progressive | Henry A. Wallace | 42,683 | 2.19% | 0 | |
| National Prohibition | Claude A. Watson | 10,593 | 0.54% | 0 | |
| Socialist | Norman Thomas | 10,521 | 0.54% | 0 | |
| Socialist Workers | Farrell Dobbs | 5,825 | 0.30% | 0 | |
| Socialist Labor | Edward A. Teichert | 3,354 | 0.17% | 0 | |
| Totals | 1,949,555 | 100.0% | 16 | ||
Results by county
[edit]| County | Thomas E. Dewey[3] Republican |
Harry S. Truman[3] Democratic |
Henry A. Wallace[3] Independent Progressive |
Claude A. Watson[3] National Prohibition |
Norman M. Thomas[3] Socialist |
Farrell Dobbs[3] Socialist Workers |
Edward A. Teichert[3] Socialist Labor |
Margin | Total votes cast | ||||||||
|---|---|---|---|---|---|---|---|---|---|---|---|---|---|---|---|---|---|
| # | % | # | % | # | % | # | % | # | % | # | % | # | % | # | % | ||
| Atlantic | 31,608 | 54.43% | 25,313 | 43.59% | 995 | 1.71% | 56 | 0.10% | 79 | 0.14% | 8 | 0.01% | 12 | 0.02% | 6,295 | 10.84% | 58,071 |
| Bergen | 142,657 | 65.70% | 69,132 | 31.84% | 3,503 | 1.61% | 327 | 0.15% | 1,312 | 0.60% | 82 | 0.04% | 118 | 0.05% | 73,525 | 33.86% | 217,131 |
| Burlington | 21,183 | 49.92% | 20,801 | 49.02% | 278 | 0.66% | 41 | 0.10% | 126 | 0.30% | 1 | 0.00% | 2 | 0.00% | 382 | 0.90% | 42,432 |
| Camden | 51,977 | 42.91% | 66,388 | 54.81% | 1,886 | 1.56% | 117 | 0.10% | 419 | 0.35% | 313 | 0.26% | 32 | 0.03% | -14,411 | -11.90% | 121,132 |
| Cape May | 11,227 | 64.46% | 6,031 | 34.63% | 118 | 0.68% | 14 | 0.08% | 20 | 0.11% | 5 | 0.03% | 2 | 0.01% | 5,196 | 29.83% | 17,417 |
| Cumberland | 16,556 | 51.24% | 15,195 | 47.02% | 449 | 1.39% | 42 | 0.13% | 46 | 0.14% | 7 | 0.02% | 18 | 0.06% | 1,361 | 4.21% | 32,313 |
| Essex | 166,963 | 48.60% | 155,468 | 45.25% | 11,741 | 3.42% | 6,560 | 1.91% | 2,004 | 0.58% | 343 | 0.10% | 488 | 0.14% | 11,495 | 3.35% | 343,567 |
| Gloucester | 19,477 | 54.46% | 15,785 | 44.14% | 349 | 0.98% | 47 | 0.13% | 97 | 0.27% | 7 | 0.02% | 3 | 0.01% | 3,692 | 10.32% | 35,765 |
| Hudson | 111,113 | 36.47% | 182,979 | 60.06% | 6,049 | 1.99% | 2,920 | 0.96% | 1,146 | 0.38% | 148 | 0.05% | 298 | 0.10% | -71,866 | -23.59% | 304,653 |
| Hunterdon | 10,654 | 60.85% | 6,515 | 37.21% | 250 | 1.43% | 18 | 0.10% | 61 | 0.35% | 1 | 0.01% | 10 | 0.06% | 4,139 | 23.64% | 17,509 |
| Mercer | 37,794 | 42.26% | 49,690 | 55.56% | 1,451 | 1.62% | 31 | 0.03% | 457 | 0.51% | 6 | 0.01% | 7 | 0.01% | -11,896 | -13.30% | 89,436 |
| Middlesex | 49,810 | 42.86% | 61,634 | 53.04% | 2,649 | 2.28% | 94 | 0.08% | 1,791 | 1.54% | 136 | 0.12% | 96 | 0.08% | -11,824 | -10.17% | 116,210 |
| Monmouth | 52,908 | 62.22% | 30,507 | 35.88% | 1,343 | 1.58% | 48 | 0.06% | 214 | 0.25% | 5 | 0.01% | 8 | 0.01% | 22,401 | 26.34% | 85,033 |
| Morris | 42,558 | 68.01% | 18,864 | 30.15% | 746 | 1.19% | 22 | 0.04% | 362 | 0.58% | 4 | 0.01% | 18 | 0.03% | 23,694 | 37.87% | 62,574 |
| Ocean | 16,740 | 70.43% | 6,366 | 26.79% | 579 | 2.44% | 6 | 0.03% | 74 | 0.31% | 2 | 0.01% | 0 | 0.00% | 10,374 | 43.65% | 23,767 |
| Passaic | 59,675 | 45.75% | 60,147 | 46.11% | 4,870 | 3.73% | 70 | 0.05% | 574 | 0.44% | 4,685 | 3.59% | 409 | 0.31% | -472 | -0.36% | 130,430 |
| Salem | 8,961 | 48.65% | 9,278 | 50.37% | 127 | 0.69% | 25 | 0.14% | 20 | 0.11% | 2 | 0.01% | 5 | 0.03% | -317 | -1.72% | 18,418 |
| Somerset | 22,034 | 59.77% | 14,104 | 38.26% | 543 | 1.47% | 13 | 0.04% | 162 | 0.44% | 3 | 0.01% | 3 | 0.01% | 7,930 | 21.51% | 36,862 |
| Sussex | 9,269 | 66.50% | 4,527 | 32.48% | 101 | 0.72% | 5 | 0.04% | 34 | 0.24% | 1 | 0.01% | 2 | 0.01% | 4,742 | 34.02% | 13,939 |
| Union | 87,402 | 53.89% | 66,759 | 41.16% | 4,514 | 2.78% | 127 | 0.08% | 1,493 | 0.92% | 66 | 0.04% | 1,819 | 1.12% | 20,643 | 12.73% | 162,180 |
| Warren | 10,558 | 50.97% | 9,972 | 48.14% | 142 | 0.69% | 10 | 0.05% | 30 | 0.14% | 2 | 0.01% | 2 | 0.01% | 586 | 2.83% | 20,716 |
| Totals | 981,124 | 50.33% | 895,455 | 45.93% | 42,683 | 2.19% | 10,593 | 0.54% | 10,521 | 0.54% | 5,825 | 0.30% | 3,354 | 0.17% | 85,669 | 4.39% | 1,949,555 |
Counties that flipped from Democratic to Republican
[edit]See also
[edit]References
[edit]- ^ "1948 Presidential General Election Results - New Jersey". Dave Leip's Atlas of U.S. Presidential Elections. Retrieved November 29, 2013.
- ^ "Results of the Primary Election Held April 20, 1948" (PDF). New Jersey Division of Elections. Retrieved August 22, 2022.
- ^ a b c d e f g "NJ US President Race, November 02, 1948". Our Campigns.


