1940 United States presidential election in Oklahoma
Appearance
| ||||||||||||||||||||||||||
All 11 Oklahoma votes to the Electoral College | ||||||||||||||||||||||||||
|---|---|---|---|---|---|---|---|---|---|---|---|---|---|---|---|---|---|---|---|---|---|---|---|---|---|---|
| ||||||||||||||||||||||||||
 County Results
| ||||||||||||||||||||||||||
| ||||||||||||||||||||||||||
| Elections in Oklahoma |
|---|
 |
|
|
The 1940 United States presidential election in Oklahoma took place on November 5, 1940, as part of the 1940 United States presidential election. Voters chose 11[2] representatives, or electors, to the Electoral College, who voted for president and vice president.
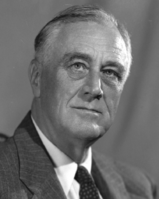
Oklahoma was won by incumbent President Franklin D. Roosevelt (D–New York), running with Secretary Henry A. Wallace, with 57.41% of the popular vote, against Wendell Willkie (R–New York), running with Minority Leader Charles L. McNary, with 42.23% of the popular vote.[3][4]
Results
[edit]| Party | Candidate | Votes | % | |
|---|---|---|---|---|
| Democratic | Franklin D. Roosevelt (inc.) | 474,313 | 57.41% | |
| Republican | Wendell Willkie | 348,872 | 42.23% | |
| Prohibition | Roger Babson | 3,027 | 0.37% | |
| Total votes | 826,212 | 100% | ||
Results by county
[edit]| County | Franklin Delano Roosevelt Democratic |
Wendell Lewis Willkie Republican |
Roger Ward Babson Prohibition |
Margin | Total votes cast[5] | ||||
|---|---|---|---|---|---|---|---|---|---|
| # | % | # | % | # | % | # | % | ||
| Adair | 3,203 | 49.40% | 3,275 | 50.51% | 6 | 0.09% | -72 | -1.11% | 6,484 |
| Alfalfa | 2,720 | 42.14% | 3,675 | 56.93% | 60 | 0.93% | -955 | -14.79% | 6,455 |
| Atoka | 3,601 | 61.75% | 2,218 | 38.03% | 13 | 0.22% | 1,383 | 23.71% | 5,832 |
| Beaver | 2,034 | 47.50% | 2,219 | 51.82% | 29 | 0.68% | -185 | -4.32% | 4,282 |
| Beckham | 4,598 | 67.79% | 2,148 | 31.67% | 37 | 0.55% | 2,450 | 36.12% | 6,783 |
| Blaine | 3,095 | 42.89% | 4,080 | 56.54% | 41 | 0.57% | -985 | -13.65% | 7,216 |
| Bryan | 9,095 | 80.42% | 2,190 | 19.36% | 25 | 0.22% | 6,905 | 61.05% | 11,310 |
| Caddo | 8,280 | 56.54% | 6,304 | 43.05% | 61 | 0.42% | 1,976 | 13.49% | 14,645 |
| Canadian | 5,506 | 53.79% | 4,699 | 45.90% | 32 | 0.31% | 807 | 7.88% | 10,237 |
| Carter | 10,441 | 75.96% | 3,270 | 23.79% | 35 | 0.25% | 7,171 | 52.17% | 13,746 |
| Cherokee | 3,952 | 48.80% | 4,128 | 50.98% | 18 | 0.22% | -176 | -2.17% | 8,098 |
| Choctaw | 5,177 | 68.47% | 2,365 | 31.28% | 19 | 0.25% | 2,812 | 37.19% | 7,561 |
| Cimarron | 989 | 53.37% | 841 | 45.39% | 23 | 1.24% | 148 | 7.99% | 1,853 |
| Cleveland | 5,933 | 61.48% | 3,660 | 37.93% | 57 | 0.59% | 2,273 | 23.55% | 9,650 |
| Coal | 2,377 | 67.24% | 1,148 | 32.48% | 10 | 0.28% | 1,229 | 34.77% | 3,535 |
| Comanche | 6,796 | 64.51% | 3,703 | 35.15% | 36 | 0.34% | 3,093 | 29.36% | 10,535 |
| Cotton | 3,121 | 65.57% | 1,616 | 33.95% | 23 | 0.48% | 1,505 | 31.62% | 4,760 |
| Craig | 4,316 | 54.52% | 3,582 | 45.24% | 19 | 0.24% | 734 | 9.27% | 7,917 |
| Creek | 10,976 | 53.55% | 9,468 | 46.20% | 51 | 0.25% | 1,508 | 7.36% | 20,495 |
| Custer | 4,612 | 57.14% | 3,419 | 42.36% | 40 | 0.50% | 1,193 | 14.78% | 8,071 |
| Delaware | 3,417 | 50.70% | 3,305 | 49.04% | 17 | 0.25% | 112 | 1.66% | 6,739 |
| Dewey | 2,391 | 47.46% | 2,613 | 51.87% | 34 | 0.67% | -222 | -4.41% | 5,038 |
| Ellis | 1,657 | 43.20% | 2,162 | 56.36% | 17 | 0.44% | -505 | -13.16% | 3,836 |
| Garfield | 9,544 | 46.55% | 10,792 | 52.64% | 166 | 0.81% | -1,248 | -6.09% | 20,502 |
| Garvin | 7,001 | 70.02% | 2,958 | 29.58% | 40 | 0.40% | 4,043 | 40.43% | 9,999 |
| Grady | 8,075 | 65.03% | 4,299 | 34.62% | 43 | 0.35% | 3,776 | 30.41% | 12,417 |
| Grant | 2,970 | 46.39% | 3,394 | 53.01% | 38 | 0.59% | -424 | -6.62% | 6,402 |
| Greer | 3,524 | 74.35% | 1,195 | 25.21% | 21 | 0.44% | 2,329 | 49.14% | 4,740 |
| Harmon | 2,292 | 75.37% | 731 | 24.04% | 18 | 0.59% | 1,561 | 51.33% | 3,041 |
| Harper | 1,419 | 46.18% | 1,616 | 52.59% | 38 | 1.24% | -197 | -6.41% | 3,073 |
| Haskell | 3,896 | 59.34% | 2,661 | 40.53% | 9 | 0.14% | 1,235 | 18.81% | 6,566 |
| Hughes | 6,005 | 65.31% | 3,168 | 34.46% | 21 | 0.23% | 2,837 | 30.86% | 9,194 |
| Jackson | 4,832 | 75.41% | 1,540 | 24.03% | 36 | 0.56% | 3,292 | 51.37% | 6,408 |
| Jefferson | 3,814 | 75.38% | 1,226 | 24.23% | 20 | 0.40% | 2,588 | 51.15% | 5,060 |
| Johnston | 2,955 | 68.26% | 1,362 | 31.46% | 12 | 0.28% | 1,593 | 36.80% | 4,329 |
| Kay | 10,725 | 51.36% | 10,003 | 47.90% | 156 | 0.75% | 722 | 3.46% | 20,884 |
| Kingfisher | 2,865 | 43.36% | 3,718 | 56.27% | 25 | 0.38% | -853 | -12.91% | 6,608 |
| Kiowa | 4,679 | 64.52% | 2,539 | 35.01% | 34 | 0.47% | 2,140 | 29.51% | 7,252 |
| Latimer | 3,138 | 65.84% | 1,600 | 33.57% | 28 | 0.59% | 1,538 | 32.27% | 4,766 |
| Le Flore | 8,379 | 64.03% | 4,664 | 35.64% | 44 | 0.34% | 3,715 | 28.39% | 13,087 |
| Lincoln | 5,271 | 45.54% | 6,269 | 54.16% | 34 | 0.29% | -998 | -8.62% | 11,574 |
| Logan | 4,752 | 46.47% | 5,427 | 53.08% | 46 | 0.45% | -675 | -6.60% | 10,225 |
| Love | 2,485 | 78.07% | 687 | 21.58% | 11 | 0.35% | 1,798 | 56.49% | 3,183 |
| Major | 1,404 | 28.71% | 3,453 | 70.60% | 34 | 0.70% | -2,049 | -41.89% | 4,891 |
| Marshall | 2,723 | 72.23% | 1,032 | 27.37% | 15 | 0.40% | 1,691 | 44.85% | 3,770 |
| Mayes | 4,057 | 52.63% | 3,631 | 47.10% | 21 | 0.27% | 426 | 5.53% | 7,709 |
| McClain | 3,768 | 66.80% | 1,862 | 33.01% | 11 | 0.20% | 1,906 | 33.79% | 5,641 |
| McCurtain | 6,994 | 75.63% | 2,225 | 24.06% | 29 | 0.31% | 4,769 | 51.57% | 9,248 |
| McIntosh | 3,771 | 51.84% | 3,487 | 47.93% | 17 | 0.23% | 284 | 3.90% | 7,275 |
| Murray | 3,126 | 71.35% | 1,238 | 28.26% | 17 | 0.39% | 1,888 | 43.10% | 4,381 |
| Muskogee | 12,917 | 57.28% | 9,585 | 42.50% | 49 | 0.22% | 3,332 | 14.78% | 22,551 |
| Noble | 3,226 | 48.34% | 3,441 | 51.56% | 7 | 0.10% | -215 | -3.22% | 6,674 |
| Nowata | 3,615 | 51.20% | 3,406 | 48.24% | 39 | 0.55% | 209 | 2.96% | 7,060 |
| Okfuskee | 4,574 | 60.19% | 3,001 | 39.49% | 24 | 0.32% | 1,573 | 20.70% | 7,599 |
| Oklahoma | 53,649 | 59.86% | 35,639 | 39.77% | 329 | 0.37% | 18,010 | 20.10% | 89,617 |
| Okmulgee | 11,016 | 61.90% | 6,696 | 37.63% | 84 | 0.47% | 4,320 | 24.28% | 17,796 |
| Osage | 9,019 | 58.26% | 6,419 | 41.46% | 43 | 0.28% | 2,600 | 16.79% | 15,481 |
| Ottawa | 7,873 | 57.69% | 5,738 | 42.05% | 35 | 0.26% | 2,135 | 15.65% | 13,646 |
| Pawnee | 3,435 | 46.02% | 3,991 | 53.47% | 38 | 0.51% | -556 | -7.45% | 7,464 |
| Payne | 7,704 | 52.99% | 6,772 | 46.58% | 63 | 0.43% | 932 | 6.41% | 14,539 |
| Pittsburg | 10,169 | 69.29% | 4,484 | 30.55% | 23 | 0.16% | 5,685 | 38.74% | 14,676 |
| Pontotoc | 9,310 | 72.77% | 3,449 | 26.96% | 35 | 0.27% | 5,861 | 45.81% | 12,794 |
| Pottawatomie | 12,058 | 63.76% | 6,776 | 35.83% | 78 | 0.41% | 5,282 | 27.93% | 18,912 |
| Pushmataha | 3,952 | 69.70% | 1,709 | 30.14% | 9 | 0.16% | 2,243 | 39.56% | 5,670 |
| Roger Mills | 2,580 | 62.83% | 1,504 | 36.63% | 22 | 0.54% | 1,076 | 26.21% | 4,106 |
| Rogers | 4,028 | 49.49% | 4,086 | 50.20% | 25 | 0.31% | -58 | -0.71% | 8,139 |
| Seminole | 11,167 | 61.75% | 6,880 | 38.05% | 36 | 0.20% | 4,287 | 23.71% | 18,083 |
| Sequoyah | 4,469 | 53.97% | 3,803 | 45.92% | 9 | 0.11% | 666 | 8.04% | 8,281 |
| Stephens | 6,149 | 67.04% | 2,989 | 32.59% | 34 | 0.37% | 3,160 | 34.45% | 9,172 |
| Texas | 2,831 | 59.26% | 1,918 | 40.15% | 28 | 0.59% | 913 | 19.11% | 4,777 |
| Tillman | 4,920 | 75.60% | 1,564 | 24.03% | 24 | 0.37% | 3,356 | 51.57% | 6,508 |
| Tulsa | 33,098 | 44.99% | 40,342 | 54.83% | 135 | 0.18% | -7,244 | -9.85% | 73,575 |
| Wagoner | 2,946 | 38.67% | 4,647 | 61.00% | 25 | 0.33% | -1,701 | -22.33% | 7,618 |
| Washington | 6,289 | 45.85% | 7,387 | 53.86% | 40 | 0.29% | -1,098 | -8.01% | 13,716 |
| Washita | 4,256 | 58.74% | 2,978 | 41.10% | 11 | 0.15% | 1,278 | 17.64% | 7,245 |
| Woods | 3,506 | 50.04% | 3,440 | 49.09% | 61 | 0.87% | 66 | 0.94% | 7,007 |
| Woodward | 2,806 | 44.95% | 3,403 | 54.51% | 34 | 0.54% | -597 | -9.56% | 6,243 |
| Totals | 474,313 | 57.41% | 348,912 | 42.23% | 3,027 | 0.37% | 125,401 | 15.18% | 826,252 |
Counties that flipped Democratic to Republican
[edit]- Adair
- Beaver
- Blaine
- Alfalfa
- Dewey
- Harper
- Ellis
- Garfield
- Lincoln
- Logan
- Kingfisher
- Noble
- Pawnee
- Rogers
- Tulsa
- Washington
- Wagoner
- Woodward
See also
[edit]References
[edit]- ^ "United States Presidential election of 1940 - Encyclopædia Britannica". Retrieved September 11, 2018.
- ^ "1940 Election for the Thirty-ninth Term (1941-45)". Retrieved September 11, 2018.
- ^ "1940 Presidential General Election Results - Oklahoma". Retrieved September 11, 2018.
- ^ "The American Presidency Project - Election of 1940". Retrieved September 11, 2018.
- ^ Scammon, Richard M. (compiler); America at the Polls: A Handbook of Presidential Election Statistics 1920-1964; pp. 361-362 ISBN 0405077114


