1940 United States presidential election in Nevada
Appearance
| ||||||||||||||||||||||||||
All 3 Nevada votes to the Electoral College | ||||||||||||||||||||||||||
|---|---|---|---|---|---|---|---|---|---|---|---|---|---|---|---|---|---|---|---|---|---|---|---|---|---|---|
| ||||||||||||||||||||||||||
 County Results
| ||||||||||||||||||||||||||
| ||||||||||||||||||||||||||
| Elections in Nevada |
|---|
 |
|
|
The 1940 United States presidential election in Nevada took place on November 5, 1940, as part of the 1940 United States presidential election. State voters chose three[2] representatives, or electors, to the Electoral College, who voted for president and vice president.
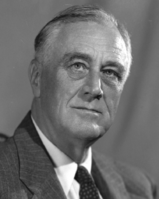
Nevada was won by incumbent President Franklin D. Roosevelt (D–New York), running with Secretary Henry A. Wallace, with 60.08% of the popular vote, against Wendell Willkie (R–New York), running with Minority Leader Charles L. McNary, with 39.92% of the popular vote.[3][4] As of the 2020 presidential election[update], this is the last election in which Lyon County and Churchill County voted for a Democratic presidential candidate.[5]
Results
[edit]| Party | Pledged to | Elector | Votes | |
|---|---|---|---|---|
| Democratic Party | Franklin D. Roosevelt | Ruth C. Ruddell | 31,945 | |
| Democratic Party | Franklin D. Roosevelt | C. W. Springer | 31,945 | |
| Democratic Party | Franklin D. Roosevelt | Joseph A. Wallace | 31,945 | |
| Republican Party | Wendell Willkie | Mark Bradshaw | 21,229 | |
| Republican Party | Wendell Willkie | N. H. Chapin | 21,229 | |
| Republican Party | Wendell Willkie | Edward F. Lunsford | 21,229 | |
| Votes cast[a] | 53,174 | |||
Results by county
[edit]| County | Franklin Delano Roosevelt Democratic |
Wendell Lewis Willkie Republican |
Margin | Total votes cast[6] | |||
|---|---|---|---|---|---|---|---|
| # | % | # | % | # | % | ||
| Churchill | 1,267 | 51.97% | 1,171 | 48.03% | 96 | 3.94% | 2,438 |
| Clark | 5,154 | 70.37% | 2,170 | 29.63% | 2,984 | 40.74% | 7,324 |
| Douglas | 330 | 35.79% | 592 | 64.21% | -262 | -28.42% | 922 |
| Elko | 3,016 | 62.85% | 1,783 | 37.15% | 1,233 | 25.69% | 4,799 |
| Esmeralda | 639 | 68.64% | 292 | 31.36% | 347 | 37.27% | 931 |
| Eureka | 353 | 55.42% | 284 | 44.58% | 69 | 10.83% | 637 |
| Humboldt | 1,367 | 63.40% | 789 | 36.60% | 378 | 19.33% | 1,956 |
| Lander | 475 | 54.72% | 393 | 45.28% | 82 | 9.45% | 868 |
| Lincoln | 1,601 | 77.64% | 461 | 22.36% | 1,140 | 55.29% | 2,062 |
| Lyon | 1,067 | 52.56% | 963 | 47.44% | 104 | 5.12% | 2,030 |
| Mineral | 693 | 63.06% | 406 | 36.94% | 287 | 26.11% | 1,099 |
| Nye | 1,206 | 62.33% | 729 | 37.67% | 477 | 24.65% | 1,935 |
| Ormsby | 785 | 51.21% | 748 | 48.79% | 37 | 2.41% | 1,533 |
| Pershing | 696 | 53.95% | 594 | 46.05% | 102 | 7.91% | 1,290 |
| Storey | 382 | 63.04% | 224 | 36.96% | 158 | 26.07% | 606 |
| Washoe | 9,243 | 53.41% | 8,062 | 46.59% | 1,181 | 6.82% | 17,305 |
| White Pine | 3,671 | 70.07% | 1,568 | 29.93% | 2,103 | 40.14% | 5,239 |
| Totals | 31,945 | 60.08% | 21,229 | 39.92% | 10,516 | 19.85% | 52,974 |
Counties that flipped from Democratic to Republican
[edit]See also
[edit]Notes
[edit]- ^ Based on totals for highest elector on each ticket
References
[edit]- ^ "United States Presidential election of 1940 – Encyclopædia Britannica". Retrieved August 21, 2018.
- ^ "1940 Election for the Thirty-ninth Term (1941-45)". Retrieved August 21, 2018.
- ^ "1940 Presidential General Election Results – Nevada". Retrieved August 21, 2018.
- ^ "The American Presidency Project – Election of 1940". Retrieved August 21, 2018.
- ^ Sullivan, Robert David; ‘How the Red and Blue Map Evolved Over the Past Century’; America Magazine in The National Catholic Review; June 29, 2016
- ^ a b Official Returns of the General Election of 1940. Carson City, Nevada: State Printing Office. p. 18.


