User:Wxtrackercody/2009 Pacific hurricane season
| Wxtrackercody/2009 Pacific hurricane season | |
|---|---|
 Season summary map | |
| Seasonal boundaries | |
| First system formed | June 18, 2009 |
| Last system dissipated | October 27, 2009 |
| Strongest storm | |
| Name | Rick |
| • Maximum winds | 180 mph (285 km/h) (1-minute sustained) |
| • Lowest pressure | 906 mbar (hPa; 26.75 inHg) |
| Seasonal statistics | |
| Total depressions | 23 |
| Total storms | 20 |
| Hurricanes | 8 |
| Major hurricanes (Cat. 3+) | 5 |
| Total fatalities | 15 |
| Total damage | $188.7 million (2009 USD) |
| Related article | |
Seasonal summary
[edit]Preseason forecast
[edit]Seasonal activity
[edit]
Storms
[edit]Tropical Depression One-E
[edit]| Tropical depression (SSHWS) | |
| Duration | June 18 – June 19 |
|---|---|
| Peak intensity | 35 mph (55 km/h) (1-min); 1003 mbar (hPa) |
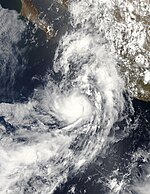
On May 29, a tropical wave departed the western coast of Africa and moved steadily westward across the Atlantic Ocean, with associated shower and thunderstorm activity confined to the Intertropical Convergence Zone. On June 10, the wave emerged into the eastern Pacific; five days later, a broad area of low pressure formed in association with the disturbance. Convective activity consolidated near the low early on June 18, and the system was declared a tropical depression at 1200 UTC as a result. Curving northward around a mid-level ridge over Mexico, the depression fell just short of tropical storm intensity as the low-level center became increasingly ill-defined. It degenerated into an open trough by 1800 UTC on June 19.[1]
Hurricane Andres
[edit]| Category 1 hurricane (SSHWS) | |
| Duration | June 21 – June 24 |
|---|---|
| Peak intensity | 80 mph (130 km/h) (1-min); 984 mbar (hPa) |
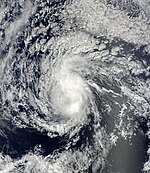
A tropical wave crossed Central America into the eastern Pacific on June 16. Continuing slowly westward, a broad area of low pressure formed in association with the wave on June 20, and convective activity steadily increased. By 1200 UTC on June 21, the wave was declared a tropical depression; six hours later, the depression was upgraded to Tropical Storm Andres. Turning northwestward around a mid-level ridge, the cyclone steadily intensified under favorable atmospheric conditions. At 0600 UTC on June 23, Andres intensified into a Category 1 hurricane and attained peak winds of 80 mph (130 km/h) with a minimum barometric pressure of 984 mb (hPa; 29.06 inHg). Thereafter, the combination of cooler sea surface temperatures, drier air, and strong northeasterly wind shear caused the system to rapidly weaken; at 0000 UTC on June 24, Andres weakened to a tropical storm, and at 1200 UTC that same day, it weakened to a tropical depression. The cyclone turned northward and degenerated into an open trough at 1800 UTC.[2]
Tropical Storm Blanca
[edit]| Tropical storm (SSHWS) | |
| Duration | July 6 – July 9 |
|---|---|
| Peak intensity | 50 mph (85 km/h) (1-min); 998 mbar (hPa) |
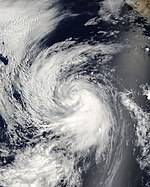
A tropical wave moved off the western coast of Africa on June 19 and emerged into the eastern Pacific ten days later. Associated convective activity began to consolidate over a broad area of low pressure on July 4, a trend that continued over the following days. By 0600 UTC on July 6, the disturbance acquired enough organization to be declared a tropical depression while located about 435 mi (700 km) south of Cabo San Lucas, Mexico. It was upgraded to Tropical Storm Blanca six hours later. Steered west-northwest on the southern side of a mid-level ridge, the cyclone continued to organize within a low wind shear environment; at 0000 UTC on July 7, it attained peak winds of 50 mph (85 km/h) before entering increasingly cool sea surface temperatures. At 1200 UTC on July 8, Blanca weakened to a tropical depression, and by 0600 UTC on July 9, the system degenerated into a remnant low. The low dissipated early on July 12.[3]
Hurricane Carlos
[edit]| Category 2 hurricane (SSHWS) | |
| Duration | July 10 – July 16 |
|---|---|
| Peak intensity | 105 mph (165 km/h) (1-min); 971 mbar (hPa) |
Tropical Storm Dolores
[edit]| Tropical storm (SSHWS) | |
| Duration | July 15 – July 16 |
|---|---|
| Peak intensity | 60 mph (95 km/h) (1-min); 997 mbar (hPa) |
Tropical Storm Lana
[edit]| Tropical storm (SSHWS) | |
| Duration | July 30 – August 2 |
|---|---|
| Peak intensity | 65 mph (100 km/h) (1-min); 995 mbar (hPa) |
Tropical Storm Enrique
[edit]| Tropical storm (SSHWS) | |
| Duration | August 3 – August 7 |
|---|---|
| Peak intensity | 65 mph (100 km/h) (1-min); 994 mbar (hPa) |
Hurricane Felicia
[edit]| Category 4 hurricane (SSHWS) | |
| Duration | August 3 – August 11 |
|---|---|
| Peak intensity | 145 mph (230 km/h) (1-min); 935 mbar (hPa) |
Tropical Depression Nine-E
[edit]| Tropical depression (SSHWS) | |
| Duration | August 9 – August 11 |
|---|---|
| Peak intensity | 35 mph (55 km/h) (1-min); 1006 mbar (hPa) |
Tropical Storm Maka
[edit]| Tropical storm (SSHWS) | |
| Duration | August 11 – August 13 |
|---|---|
| Peak intensity | 40 mph (65 km/h) (1-min); 1008 mbar (hPa) |
Hurricane Guillermo
[edit]| Category 3 hurricane (SSHWS) | |
| Duration | August 12 – August 19 |
|---|---|
| Peak intensity | 125 mph (205 km/h) (1-min); 954 mbar (hPa) |
Tropical Storm Hilda
[edit]| Tropical storm (SSHWS) | |
| Duration | August 22 – August 28 |
|---|---|
| Peak intensity | 65 mph (100 km/h) (1-min); 995 mbar (hPa) |
Tropical Storm Ignacio
[edit]| Tropical storm (SSHWS) | |
| Duration | August 24 – August 27 |
|---|---|
| Peak intensity | 50 mph (85 km/h) (1-min); 999 mbar (hPa) |
Hurricane Jimena
[edit]| Category 4 hurricane (SSHWS) | |
| Duration | August 28 – September 4 |
|---|---|
| Peak intensity | 155 mph (250 km/h) (1-min); 931 mbar (hPa) |
Tropical Depression Two-C
[edit]| Tropical depression (SSHWS) | |
| Duration | August 28 – August 30 |
|---|---|
| Peak intensity | 35 mph (55 km/h) (1-min); 1007 mbar (hPa) |
Tropical Storm Kevin
[edit]| Tropical storm (SSHWS) | |
| Duration | August 29 – September 1 |
|---|---|
| Peak intensity | 50 mph (85 km/h) (1-min); 1000 mbar (hPa) |
Hurricane Linda
[edit]| Category 1 hurricane (SSHWS) | |
| Duration | September 7 – September 11 |
|---|---|
| Peak intensity | 80 mph (130 km/h) (1-min); 985 mbar (hPa) |
Tropical Storm Marty
[edit]| Tropical storm (SSHWS) | |
| Duration | September 16 – September 19 |
|---|---|
| Peak intensity | 45 mph (75 km/h) (1-min); 1002 mbar (hPa) |
Tropical Storm Nora
[edit]| Tropical storm (SSHWS) | |
| Duration | September 23 – September 25 |
|---|---|
| Peak intensity | 60 mph (95 km/h) (1-min); 997 mbar (hPa) |
Tropical Storm Olaf
[edit]| Tropical storm (SSHWS) | |
| Duration | October 1 – October 3 |
|---|---|
| Peak intensity | 45 mph (75 km/h) (1-min); 996 mbar (hPa) |
Tropical Storm Patricia
[edit]| Tropical storm (SSHWS) | |
| Duration | October 11 – October 14 |
|---|---|
| Peak intensity | 60 mph (95 km/h) (1-min); 996 mbar (hPa) |
Hurricane Rick
[edit]| Category 5 hurricane (SSHWS) | |
| Duration | October 15 – October 21 |
|---|---|
| Peak intensity | 180 mph (285 km/h) (1-min); 906 mbar (hPa) |
Hurricane Neki
[edit]| Category 3 hurricane (SSHWS) | |
| Duration | October 18 – October 27 |
|---|---|
| Peak intensity | 125 mph (205 km/h) (1-min); 950 mbar (hPa) |
Storm names
[edit]The names on the following list were used to name storms that formed in Northeastern Pacific Ocean during 2009. This is the same list used in the 2003 season and will be reused during 2015 due to the lack of any name retirements. The first Central Pacific name to be used was Lana, when it crossed into the region from the Eastern Pacific. With the naming of Tropical Storm Maka on August 11, this season became the first in seven years to use multiple Central Pacific names.[4]
|
For storms that form in the Central Pacific Hurricane Center's area of responsibility, encompassing the area between 140 degrees west and the International Date Line, all names are used in a series of four rotating lists. The next four names that were slated for use in 2009 are shown below. Three of them, Lana, Maka, and Neki, were used throughout the course of the year.
|
|
|
Season effects
[edit]The following table lists all of the storms that have formed in the 2007 Pacific hurricane season. It includes their duration, names, landfall(s) (in parentheses), damages, and death totals. Deaths in parentheses are additional and indirect (an example of an indirect death would be a traffic accident), but were still related to that storm. Damage and deaths include totals while the storm was extratropical, a wave, or a low, and all of the damage figures are in 2007 USD.
| Saffir–Simpson scale | ||||||
| TD | TS | C1 | C2 | C3 | C4 | C5 |
| Storm name |
Dates active | Storm category at peak intensity |
Max 1-min wind mph (km/h) |
Min. press. (mbar) |
Areas affected | Damage (USD) |
Deaths | Ref(s) | ||
|---|---|---|---|---|---|---|---|---|---|---|
| One-E | June 18 – June 19 | Tropical depression | 35 (55) | 1003 | Northwest Mexico | Unknown | 0 | |||
| Andres | June 21 – June 24 | Category 1 hurricane | 80 (130) | 984 | Southwestern Mexico, Western Mexico, Honduras | 0.231 | 5 | |||
| Blanca | July 6 – July 9 | Tropical storm | 50 (85) | 998 | Western Mexico, California | Unknown | 0 | |||
| Carlos | July 10 – July 16 | Category 2 hurricane | 105 (165) | 971 | None | None | 0 | |||
| Dolores | July 15 – July 16 | Tropical storm | 60 (95) | 997 | None | None | 0 | |||
| Lana | July 30 – August 2 | Tropical storm | 65 (100) | 995 | None | None | 0 | |||
| Enrique | August 3 – August 7 | Tropical storm | 65 (100) | 994 | None | None | 0 | |||
| Felicia | August 3 – August 11 | Category 4 hurricane | 145 (230) | 935 | Hawaii | Unknown | 0 | |||
| Nine-E | August 9 – August 11 | Tropical depression | 35 (55) | 1006 | None | None | 0 | |||
| Maka | August 11 – August 13 | Tropical storm | 40 (65) | 1008 | None | None | 0 | |||
| Guillermo | August 12 – August 19 | Category 3 hurricane | 125 (205) | 954 | Hawaii | None | 0 | |||
| Hilda | August 22 – August 28 | Tropical storm | 65 (100) | 995 | None | None | 0 | |||
| Ignacio | August 24 – August 27 | Tropical storm | 50 (85) | 999 | None | None | 0 | |||
| Jimena | August 28 – September 4 | Category 4 hurricane | 155 (250) | 931 | Western Mexico, Northwest Mexico (Baja California Sur) | 173.9 | 6 | |||
| Two-C | August 28 – August 30 | Tropical depression | 35 (55) | 1007 | None | None | 0 | |||
| Kevin | August 29 – September 1 | Tropical storm | 50 (85) | 1000 | None | None | 0 | |||
| Linda | September 7 – September 11 | Category 1 hurricane | 80 (130) | 985 | None | None | 0 | |||
| Marty | September 16 – September 19 | Tropical storm | 45 (75) | 1002 | None | None | 0 | |||
| Nora | September 23 – September 25 | Tropical storm | 60 (95) | 997 | None | None | 0 | |||
| Olaf | October 1 – October 3 | Tropical storm | 45 (75) | 996 | Northwest Mexico | None | 0 | |||
| Patricia | October 11 – October 14 | Tropical storm | 60 (95) | 996 | Northwest Mexico | Minimal | 0 | |||
| Rick | October 15 – October 21 | Category 5 hurricane | 180 (285) | 906 | Western Mexico (Sinaloa), Northwest Mexico | 14.6 | 4 | |||
| Neki | October 18 – October 27 | Category 3 hurricane | 125 (205) | 950 | Hawaii | None | 0 | |||
| Season aggregates | ||||||||||
| 23 systems | June 18 – October 27 | 180 (285) | 906 | 188.731 | 15 | |||||
See also
[edit]- List of Pacific hurricanes
- List of Pacific hurricane seasons
- 2009 Atlantic hurricane season
- 2009 Pacific typhoon season
- 2009 North Indian Ocean cyclone season
- South-West Indian Ocean cyclone seasons: 2008–09, 2009–10
- Australian region cyclone seasons: 2008–09, 2009–10
- South Pacific cyclone seasons: 2008–09, 2009–10
References
[edit]- ^ Eric S. Blake (July 31, 2009). Tropical Cyclone Report: Tropical Depression One-E (PDF). National Hurricane Center (Report). Miami, Florida: National Oceanic and Atmospheric Administration. Retrieved June 11, 2014.
- ^ Daniel P. Brown (July 21, 2009). Tropical Cyclone Report: Hurricane Andres (PDF). National Hurricane Center (Report). Miami, Florida: National Oceanic and Atmospheric Administration. Retrieved July 12, 2014.
- ^ Richard J. Pasch (November 23, 2009). Tropical Cyclone Report: Tropical Storm Blanca (PDF). National Hurricane Center (Report). Miami, Florida: National Oceanic and Atmospheric Administration. Retrieved June 15, 2014.
- ^ National Hurricane Center; Hurricane Research Division; Central Pacific Hurricane Center (April 26, 2024). "The Northeast and North Central Pacific hurricane database 1949–2023". United States National Oceanic and Atmospheric Administration's National Weather Service. Archived from the original on May 29, 2024. A guide on how to read the database is available here.
 This article incorporates text from this source, which is in the public domain.


