Jump to content

Maryland's 7th congressional district

Coordinates: 39°18′N 76°54′W / 39.3°N 76.9°W / 39.3; -76.9
From Wikipedia, the free encyclopedia

Maryland's 7th congressional district
Map
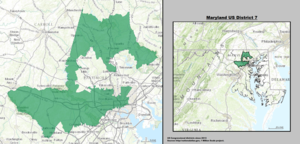
Interactive map of district boundaries since January 3, 2023
Representative
Area294.25 sq mi (762.1 km2)
Distribution
  • 95% urban
  • 5% rural
Population (2023)744,512
Median household
income
$61,399[1]
Ethnicity
Occupation
Cook PVID+30[2]

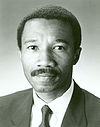
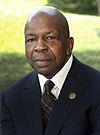
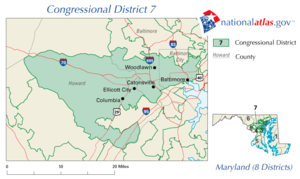
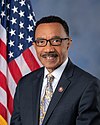
Maryland's 7th congressional district of the United States House of Representatives encompasses almost the entire city of Baltimore, and some of Baltimore County. The district was created following the census of 1790, which gave Maryland one additional representative in the House. It was abolished in 1843, but was restored in 1950 as a west Baltimore district. It has been drawn as a majority-African American district since 1973. Democrat Kweisi Mfume is the current representative, winning a special election on April 28, 2020, to finish the term of Elijah Cummings, who died in October 2019.[3] Mfume had previously held the seat from 1987 to 1996.

Recent statewide election results

[edit]
Year Office Results
2000 President Gore 84% - 14%
2004 President Kerry 73% - 26%
2008 President Obama 78% - 19%
2012 President Obama 76% - 22%
2016 President Clinton 74% - 22%
2020 President Biden 78% - 20%

Composition

[edit]
# County Seat Population
5 Baltimore (county) Towson 844,703
510 Baltimore (city) Baltimore 576,498

Cities of 10,000 or more people

[edit]

2,500 – 10,000 people

[edit]

List of members representing the district

[edit]
# Member Party Years Con-
gress
Electoral history District location
District created March 4, 1793
1
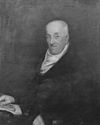
William Hindman
(Talbot County)
Pro-Administration March 4, 1793 –
March 3, 1795
3rd
4th
5th
Redistricted from the 2nd district, and re-elected in 1792.
Re-elected in 1794.
Re-elected in 1796.
Lost re-election.
1793–1803
[data missing]
Federalist March 4, 1795 –
March 3, 1799
2
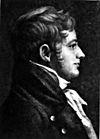
Joseph H. Nicholson
(Chestertown)
Democratic-Republican March 4, 1799 –
March 1, 1806
6th
7th
8th
9th
Elected November 29, 1798 to begin member-elect Joshua Seney's term.
Re-elected in 1801.
Re-elected in 1803.
Re-elected in 1804.
Resigned.
1803–1813
[data missing]
Vacant March 1, 1806 –
December 3, 1806
9th
3
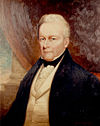
Edward Lloyd
(Wye Mills)
Democratic-Republican December 3, 1806 –
March 3, 1809
9th
10th
Elected September 27 and October 4, 1806, to finish Nicholson's term.
Re-elected October 6, 1806.
Re-elected in 1808.
Retired.
4 John Brown
(Centerville)
Democratic-Republican March 4, 1809 –
??, 1810
11th Elected in 1808.
Re-elected in 1810.
Resigned to become Clerk of Court of Queen Anne's County.
Vacant ??, 1810 –
November 29, 1810
5
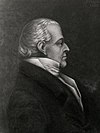
Robert Wright
(Queenstown)
Democratic-Republican November 29, 1810 –
March 3, 1817
11th
12th
13th
14th
Elected to finish Brown's term and to the next term on the same ballot.
Re-elected in 1812.
Re-elected in 1814.
Retired.
1813–1823
[data missing]
6 Thomas Culbreth
(Denton)
Democratic-Republican March 4, 1817 –
March 3, 1821
15th
16th
Elected in 1816.
Re-elected in 1818.
Lost re-election.
7
Robert Wright
(Queenstown)
Democratic-Republican March 4, 1821 –
March 3, 1823
17th Elected in 1820.
Retired.
8 William Hayward Jr.
(Easton)
Democratic-Republican (Crawford) March 4, 1823 –
March 3, 1825
18th Elected in 1822.
Retired.
1823–1833
[data missing]
9
John Leeds Kerr
(Easton)
Anti-Jacksonian March 4, 1825 –
March 3, 1829
19th
20th
Elected in 1824.
Re-elected in 1826.
Lost re-election.
10 Richard Spencer
(Easton)
Jacksonian March 4, 1829 –
March 3, 1831
21st Elected in 1829.
Lost re-election.
11
John Leeds Kerr
(Easton)
Anti-Jacksonian March 4, 1831 –
March 3, 1833
22nd Elected in 1831.
[data missing]
12
Francis Thomas
(Frederick)
Jacksonian March 4, 1833 –
March 3, 1835
23rd Redistricted from the 4th district and re-elected in 1833.
Redistricted to the 6th district.
1833–1843
[data missing]
13 Daniel Jenifer
(Milton Hill)
Anti-Jacksonian March 4, 1835 –
March 3, 1837
24th Elected in 1835.
Re-elected in 1837.
Re-elected in 1839.
[data missing]
Whig March 4, 1837 –
March 3, 1841
25th
26th
14 Augustus R. Sollers
(Prince Frederick)
Whig March 4, 1841 –
March 3, 1843
27th Elected in 1841.
[data missing]
Seat eliminated after the 1840 census.
Seat re-created after the 1950 census.
15
Samuel Friedel
(Baltimore)
Democratic January 3, 1953 –
January 3, 1971
83rd
84th
85th
86th
87th
88th
89th
90th
91st
Elected in 1952.
Re-elected in 1954.
Re-elected in 1956.
Re-elected in 1958.
Re-elected in 1960.
Re-elected in 1962.
Re-elected in 1964.
Re-elected in 1966.
Re-elected in 1968.
Lost re-nomination.
1953–1963
[data missing]
1963–1973
[data missing]
16
Parren Mitchell
(Baltimore)
Democratic January 3, 1971 –
January 3, 1987
92nd
93rd
94th
95th
96th
97th
98th
99th
100th
Elected in 1970.
Re-elected in 1972.
Re-elected in 1974.
Re-elected in 1976.
Re-elected in 1978.
Re-elected in 1980.
Re-elected in 1982.
Re-elected in 1984.
Retired to run for Lieutenant Governor of Maryland.
1973–1983
[data missing]
1983–1993
[data missing]
17
Kweisi Mfume
(Baltimore)
Democratic January 3, 1987 –
February 15, 1996
101st
102nd
103rd
104th
Elected in 1986.
Re-elected in 1988.
Re-elected in 1990.
Re-elected in 1992.
Re-elected in 1994.
Resigned to become CEO of the NAACP.
1993–2003
[data missing]
Vacant February 15, 1996 –
April 16, 1996
104th
18
Elijah Cummings
(Baltimore)
Democratic April 16, 1996 –
October 17, 2019
104th
105th
106th
107th
108th
109th
110th
111th
112th
113th
114th
115th
116th
Elected to finish Mfume's term.
Re-elected in 1996.
Re-elected in 1998.
Re-elected in 2000.
Re-elected in 2002.
Re-elected in 2004.
Re-elected in 2006.
Re-elected in 2008.
Re-elected in 2010.
Re-elected in 2012.
Re-elected in 2014.
Re-elected in 2016.
Re-elected in 2018.
Died.
2003–2013
2013–2023
Vacant October 17, 2019 –
May 5, 2020
116th
19
Kweisi Mfume
(Baltimore)
Democratic May 5, 2020 –
present
116th
117th
118th
Elected to finish Cummings's term and seated May 5, 2020.
Re-elected in 2020.
Re-elected in 2022.
2023–present

Recent elections

[edit]

2000s

[edit]
Maryland's 7th congressional district election, 2000[4]
Party Candidate Votes %
Democratic Elijah Cummings (Incumbent) 134,066 87.1
Republican Kenneth Kondner 19,773 12.8
Write-ins 135 0.10
Total votes 153,974 100.00
Democratic hold
Maryland's 7th congressional district election, 2002[4]
Party Candidate Votes %
Democratic Elijah Cummings (Incumbent) 137,047 73.6
Republican Joseph Ward 49,172 26.4
Total votes 186,219 100.00
Democratic hold
Maryland's 7th congressional district election, 2004[4]
Party Candidate Votes %
Democratic Elijah Cummings (Incumbent) 179,189 73.4
Republican Tony Salazar 60,102 26.4
Green Virginia Rodino 4,727 1.9
Total votes 244,018 100.00
Democratic hold
Maryland's 7th congressional district election, 2006[4]
Party Candidate Votes %
Democratic Elijah Cummings (Incumbent) 158,830 98.1
Write-ins 3,147 1.9
Total votes 161,977 100.00
Democratic hold
Maryland's 7th congressional district election, 2008[4]
Party Candidate Votes %
Democratic Elijah Cummings (Incumbent) 227,379 79.5
Republican Michael Hargadon 53,147 18.6
Libertarian Ronald Owens-Bey 4,727 1.8
Write-ins 280 0.1
Total votes 286,020 100.00
Democratic hold

2010s

[edit]
Maryland's 7th congressional district election, 2010[4]
Party Candidate Votes %
Democratic Elijah Cummings (Incumbent) 152,669 75.2
Republican Frank Mirabile 46,375 22.8
Libertarian Scott Spencer 3,814 1.9
Write-ins 210 0.1
Total votes 203,068 100.00
Democratic hold
Maryland's 7th congressional district, 2012[5]
Party Candidate Votes %
Democratic Elijah Cummings (incumbent) 247,770 76.5
Republican Frank C. Mirabile 67,405 20.8
Libertarian Ronald M. Owens-Bey 8,211 2.5
n/a Write-ins 432 0.1
Total votes 323,818 100.0
Democratic hold
Maryland's 7th congressional district, 2014[6]
Party Candidate Votes %
Democratic Elijah Cummings (incumbent) 144,639 69.7
Republican Corrogan R. Vaughn 55,860 27.2
Libertarian Scott Soffen 6,103 3.0
n/a Write-ins 207 0.1
Total votes 206,809 100.0
Democratic hold
Maryland's 7th congressional district, 2016[7]
Party Candidate Votes %
Democratic Elijah Cummings (incumbent) 238,838 74.9
Republican Corrogan R. Vaughn 69,556 21.8
Green Myles B. Hoenig 9,715 3.0
n/a Write-ins 601 0.2
Republican Wayne T. Newton (write-in) 202 0.1
Total votes 318,912 100.0
Democratic hold
Maryland's 7th congressional district, 2018[8]
Party Candidate Votes %
Democratic Elijah Cummings (incumbent) 202,345 76.4
Republican Richmond Davis 56,266 21.3
Libertarian David Griggs 5,827 2.2
n/a Write-ins 272 0.1
Total votes 264,710 100.0
Democratic hold

2020s

[edit]
Maryland's 7th congressional district special election, 2020[9]
Party Candidate Votes %
Democratic Kweisi Mfume 111,955 73.8%
Republican Kimberly Klacik 38,102 25.1%
Independent Peter James (write-in) 1 0.0%
Independent Other Write-Ins 1,660 1.1%
Total votes 151,718 100.0
Democratic hold
Maryland's 7th congressional district, 2020[10]
Party Candidate Votes %
Democratic Kweisi Mfume (incumbent) 237,084 71.6
Republican Kimberly Klacik 92,825 28.0
Write-in 1,089 0.3
Total votes 330,998 100.0
Democratic hold
Maryland's 7th congressional district, 2022
Party Candidate Votes %
Democratic Kweisi Mfume (incumbent) 151,640 82.1
Republican Scott Collier 32,737 17.7
Write-in 424 0.2
Total votes 184,801 100.0
Democratic hold

See also

[edit]

References

[edit]
  1. ^ Center for New Media & Promotion (CNMP), US Census Bureau. "My Congressional District". www.census.gov.
  2. ^ "2022 Cook PVI: District Map and List". The Cook Political Report. July 12, 2022. Retrieved October 8, 2022.
  3. ^ Reed, Kai (April 29, 2020). "Election results: Kweisi Mfume declared winner of Maryland's 7th District Congress seat". WBAL. Retrieved April 29, 2020.
  4. ^ a b c d e f "Maryland's 7th Congressional District". Ballotpedia. Retrieved August 1, 2022.
  5. ^ "Official 2012 Presidential General Election results for Representative in Congress". Maryland State Board of Elections. Retrieved November 12, 2012.
  6. ^ Haas, Karen L. (March 9, 2015). "Statistics of the Congressional Election of November 4, 2014". Clerk of the U.S. House of Representatives. Retrieved October 28, 2019.
  7. ^ "Official 2016 Presidential General Election results for Representative in Congress". Maryland Secretary of State. Retrieved December 9, 2016.
  8. ^ Johnson, Cheryl L. (February 28, 2019). "Statistics of the Congressional Election of November 6, 2018". Clerk of the U.S. House of Representatives. Retrieved April 27, 2019.
  9. ^ "Official 2020 Special General Election results for Representative in Congress". elections.maryland.gov. State Board of Elections. May 12, 2020. Retrieved May 14, 2020.
  10. ^ "Official 2020 Presidential General Election results for Representative in Congress". Maryland State Board of Elections. Retrieved December 14, 2020.

Bibliography

[edit]

39°18′N 76°54′W / 39.3°N 76.9°W / 39.3; -76.9