Longchuan County, Guangdong
Longchuan
龙川县 | |
|---|---|
 | |
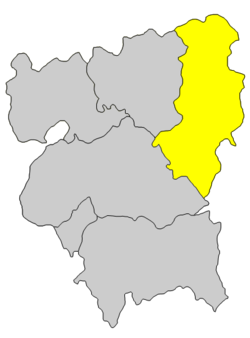
 Location in Heyuan City | |
| Coordinates: 24°20′N 115°22′E / 24.333°N 115.367°E | |
| Country | People's Republic of China |
| Province | Guangdong |
| Prefecture-level city | Heyuan |
| County seat | Laolong (老隆镇) |
| Area | |
• Total | 3,088 km2 (1,192 sq mi) |
| Population (2020 census) | |
• Total | 595,471 |
| • Density | 190/km2 (500/sq mi) |
| Time zone | UTC+8 (China Standard) |
| Postal code | 517300 |
| Area code | 0762 |
| Website | www |
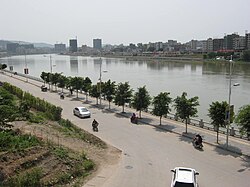
Longchuan County (postal: Lungchun; simplified Chinese: 龙川县; traditional Chinese: 龍川縣; pinyin: Lóngchuān Xiàn; lit. 'dragon river county', Hakka: Liùngchôn) is a county of northeastern Guangdong province, China, bordering Jiangxi to the north and on the upper reaches of the Dong and Han Rivers. It is under the administration of Heyuan City, and in 2020 had a population of 595,471[1] living in an area of 3,088 km2 (1,192 sq mi). Bordering county-level divisions are Xingning and Wuhua County to the east, Heping County and Dongyuan County to the south and west, and in Jiangxi, Dingnan County and Xunwu County to the north.
Administrative divisions
[edit]
Longchuan administers 24 towns:
- Laolong (老隆镇)
- Sidu (四都镇)
- Huangshi (黄石镇)
- Xi'ao (细坳镇)
- Chetian (车田镇)
- Beiling (贝岭镇)
- Liju (黎咀镇)
- Shanping (上坪镇)
- Fengren (丰稔镇)
- Chiguang (赤光镇)
- Longmu (龙母镇)
- Huilong (回龙镇)
- Tianxin (田心镇)
- Tiechang (铁场镇)
- Dengyun (登云镇)
- Tongqu (通衢镇)
- Heshi (鹤市镇)
- Huangbu (黄布镇)
- Zishi (紫市镇)
- Tuocheng (佗城镇)
- Yanzhen (岩镇镇)
- Xintian (新田镇)
- Yidu (义都镇)
- Mabugang (麻布岗镇)
Transport
[edit]
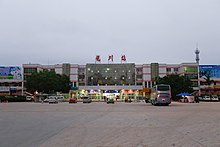
Longchuan has a developed highway and railway network. Major roads include the China National Highway 205 (G205) and Guangdong Provincial Highway 120 (S120). The Beijing–Kowloon, Guangzhou–Meizhou–Shantou and Zhangping–Longchuan Railways intersect in Longchuan, making it an important railway hub for the Lingnan region.
Sights
[edit]-
Longchuan City Wall
-
Longchuan Confucian Temple
-
Tuocheng Theater
-
Zhengxiang Pagoda
Climate
[edit]| Climate data for Longchuan (1991–2020 normals, extremes 1981–2010) | |||||||||||||
|---|---|---|---|---|---|---|---|---|---|---|---|---|---|
| Month | Jan | Feb | Mar | Apr | May | Jun | Jul | Aug | Sep | Oct | Nov | Dec | Year |
| Record high °C (°F) | 28.3 (82.9) |
30.2 (86.4) |
32.9 (91.2) |
35.0 (95.0) |
36.8 (98.2) |
38.7 (101.7) |
39.1 (102.4) |
39.5 (103.1) |
37.4 (99.3) |
36.1 (97.0) |
34.5 (94.1) |
29.9 (85.8) |
39.5 (103.1) |
| Mean daily maximum °C (°F) | 17.1 (62.8) |
19.1 (66.4) |
21.9 (71.4) |
26.3 (79.3) |
29.9 (85.8) |
32.0 (89.6) |
33.9 (93.0) |
33.5 (92.3) |
31.7 (89.1) |
28.5 (83.3) |
24.1 (75.4) |
18.8 (65.8) |
26.4 (79.5) |
| Daily mean °C (°F) | 11.6 (52.9) |
13.8 (56.8) |
16.9 (62.4) |
21.5 (70.7) |
25.0 (77.0) |
27.2 (81.0) |
28.5 (83.3) |
28.0 (82.4) |
26.5 (79.7) |
23.0 (73.4) |
18.3 (64.9) |
13.2 (55.8) |
21.1 (70.0) |
| Mean daily minimum °C (°F) | 8.1 (46.6) |
10.3 (50.5) |
13.5 (56.3) |
18.1 (64.6) |
21.7 (71.1) |
24.0 (75.2) |
24.8 (76.6) |
24.6 (76.3) |
23.0 (73.4) |
19.2 (66.6) |
14.4 (57.9) |
9.5 (49.1) |
17.6 (63.7) |
| Record low °C (°F) | −1.0 (30.2) |
0.4 (32.7) |
0.7 (33.3) |
6.6 (43.9) |
12.7 (54.9) |
17.6 (63.7) |
18.7 (65.7) |
20.2 (68.4) |
15.6 (60.1) |
8.2 (46.8) |
2.9 (37.2) |
−2.5 (27.5) |
−2.5 (27.5) |
| Average precipitation mm (inches) | 59.1 (2.33) |
77.7 (3.06) |
154.1 (6.07) |
195.2 (7.69) |
235.1 (9.26) |
278.9 (10.98) |
173.9 (6.85) |
210.9 (8.30) |
127.9 (5.04) |
44.8 (1.76) |
47.1 (1.85) |
47.7 (1.88) |
1,652.4 (65.07) |
| Average precipitation days (≥ 0.1 mm) | 7.7 | 10.4 | 15.6 | 15.5 | 17.8 | 18.7 | 16.2 | 17.4 | 11.1 | 4.9 | 6.0 | 6.3 | 147.6 |
| Average relative humidity (%) | 74 | 77 | 80 | 80 | 80 | 81 | 78 | 79 | 77 | 70 | 71 | 70 | 76 |
| Mean monthly sunshine hours | 116.6 | 96.6 | 87.0 | 98.5 | 130.4 | 149.9 | 208.8 | 190.1 | 175.7 | 181.5 | 157.6 | 142.5 | 1,735.2 |
| Percent possible sunshine | 35 | 30 | 23 | 26 | 32 | 37 | 50 | 48 | 48 | 51 | 48 | 43 | 39 |
| Source: China Meteorological Administration[2][3] | |||||||||||||
See also
[edit]- Cowhells cake, a local specialty
References
[edit]- ^ "China: Guăngdōng (Prefectures, Cities, Districts and Counties) - Population Statistics, Charts and Map". www.citypopulation.de. Retrieved 2024-10-30.
- ^ 中国气象数据网 – WeatherBk Data (in Simplified Chinese). China Meteorological Administration. Retrieved 28 May 2023.
- ^ 中国气象数据网 (in Simplified Chinese). China Meteorological Administration. Retrieved 28 May 2023.


