List of Michigan metropolitan areas
Appearance
The following is a list of the metropolitan statistical areas in the U.S. state of Michigan, as defined by the U.S. Office of Management and Budget. Shiawassee County was added to the Lansing metropolitan area in 2018; the county is included in the Lansing MSA 2010 population.
Metropolitan statistical areas
[edit]| MI rank | U.S. rank | Metropolitan statistical area | Image | 2020 census | 2010 census | Change |
|---|---|---|---|---|---|---|
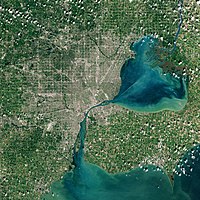
| 1 | 14 | Detroit–Warren–Dearborn, MI | 
|
4,392,041 | 4,296,250 | +2.23% |
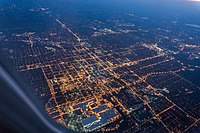
| 2 | 49 | Grand Rapids–Wyoming–Kentwood, MI | 
|
1,150,015 | 993,670 | +15.73% |
| 3 | 114 | Lansing–East Lansing, MI | 
|
541,297 | 534,684 | +1.24% |
| 4 | 136 | Flint, MI | 406,211 | 425,790 | −4.60% | |
| 5 | 153 | Ann Arbor, MI | 372,258 | 344,791 | +7.97% | |
| 6 | 190 | Kalamazoo–Portage, MI | 261,670 | 250,331 | +4.53% | |
| 7 | 239 | Saginaw, MI | 190,124 | 200,169 | −5.02% | |
| 8 | 251 | Muskegon, MI | 175,824 | 172,188 | +2.11% | |
| 9 | 270 | Jackson, MI | 160,366 | 160,248 | +0.07% | |
| 10 | 275 | Traverse City, MI | 153,448 | 143,372 | +7.03% | |
| 11 | 281 | Monroe, MI | 154,809 | 152,021 | +1.83% | |
| 12 | 285 | Niles, MI | 154,316 | 156,813 | −1.59% | |
| 13 | 308 | Battle Creek, MI | 134,310 | 136,146 | −1.35% | |
| 14 | 358 | Bay City, MI | 103,856 | 107,771 | −3.63% | |
| 15 | 376 | Midland, MI | 83,494 | 83,629 | −0.16% |
See also
[edit]References
[edit]- ^ "Metropolitan and Micropolitan Statistical Areas Population Totals and Components of Change: 2010-2019". United States Census Bureau, Population Division. March 26, 2020. Retrieved April 26, 2020.
