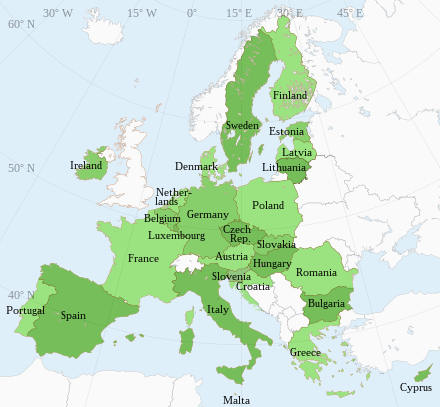
List of European Union member states by population
Appearance

Table
[edit]In coordination with member state national governments, Eurostat releases 1 January member state population figures every July; below are the 1 January 2024 data released in July 2024.[1][2]
| Country | Population (2024-01-01) |
Population (% of EU) |
|---|---|---|
| 83,445,000 | 18.6% | |
| 68,402,000 | 15.2% | |
| 58,989,700 | 13.1% | |
| 48,610,500 | 10.8% | |
| 36,621,000 | 8.2% | |
| 19,064,400 | 4.2% | |
| 17,942,900 | 4.0% | |
| 11,832,000 | 2.6% | |
| 10,900,600 | 2.4% | |
| 10,639,700 | 2.4% | |
| 10,551,700 | 2.3% | |
| 10,397,200 | 2.3% | |
| 9,584,600 | 2.1% | |
| 9,158,800 | 2.0% | |
| 6,445,500 | 1.4% | |
| 5,961,200 | 1.3% | |
| 5,603,900 | 1.2% | |
| 5,424,700 | 1.2% | |
| 5,343,800 | 1.2% | |
| 3,862,000 | 0.9% | |
| 2,885,900 | 0.6% | |
| 2,123,900 | 0.5% | |
| 1,871,900 | 0.4% | |
| 1,374,700 | 0.3% | |
| 933,500 | 0.2% | |
| 672,100 | 0.1% | |
| 563.000 | 0.1% | |
| 449,206,600 | 100.0% |
See also
[edit]- All pages with titles beginning with List of European Union member states
- List of European Union member states by area
- List of European countries by population
Notes
[edit]
- ^ Eurostat (11 July 2024). "EU population increases again in 2024". Retrieved 12 July 2024.
- ^ Eurostat (6 July 2024). "Population and population change statistics". Retrieved 12 July 2024.
