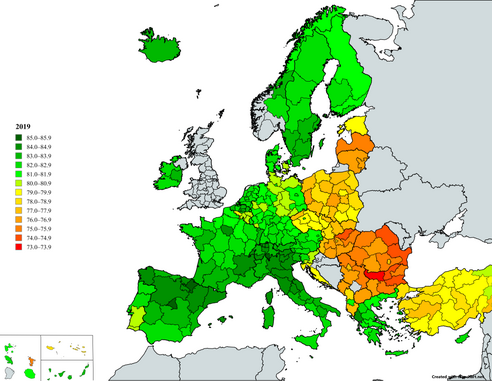
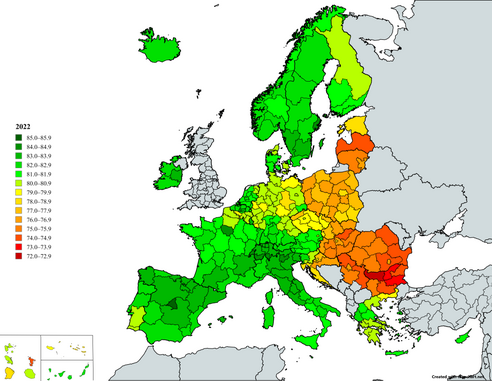
List of Belgian provinces by life expectancy
Appearance
Statistics Belgium
[edit]Statistics by province
[edit]Average values for 3-year periods. The values are rounded, all calculations were done on raw data. The sorting of provinces by total life expectancy for both periods is the same.
Data source: Statistics Belgium[1][2]

| province or region |
2020-2022 | change | 2021-2023 | ||||||
|---|---|---|---|---|---|---|---|---|---|
| overall | male | female | F Δ M | overall | male | female | F Δ M | ||
| Belgium on average | 81.38 | 79.10 | 83.62 | 4.52 | 0.50 | 81.87 | 79.66 | 84.04 | 4.38 |
| Flemish Brabant | 82.93 | 80.81 | 84.99 | 4.18 | 0.44 | 83.37 | 81.29 | 85.37 | 4.08 |
| Walloon Brabant | 82.48 | 80.28 | 84.52 | 4.25 | 0.44 | 82.92 | 80.74 | 84.93 | 4.19 |
| Limburg | 82.46 | 80.53 | 84.41 | 3.88 | 0.37 | 82.83 | 80.92 | 84.74 | 3.83 |
| Antwerp | 82.34 | 80.44 | 84.23 | 3.79 | 0.46 | 82.80 | 80.95 | 84.60 | 3.65 |
| West Flanders | 82.29 | 80.04 | 84.57 | 4.53 | 0.40 | 82.69 | 80.48 | 84.91 | 4.44 |
| East Flanders | 82.19 | 79.99 | 84.36 | 4.37 | 0.31 | 82.50 | 80.34 | 84.62 | 4.28 |
| Brussels | 80.82 | 78.19 | 83.27 | 5.08 | 0.86 | 81.68 | 79.13 | 84.01 | 4.88 |
| Belgian Luxembourg | 80.07 | 77.56 | 82.67 | 5.11 | 0.25 | 80.32 | 77.78 | 82.91 | 5.14 |
| Namur | 79.78 | 77.17 | 82.39 | 5.22 | 0.52 | 80.30 | 77.87 | 82.66 | 4.79 |
| Liège | 79.49 | 77.13 | 81.83 | 4.71 | 0.75 | 80.24 | 77.99 | 82.42 | 4.44 |
| Hainaut | 78.70 | 75.87 | 81.48 | 5.61 | 0.58 | 79.28 | 76.48 | 82.00 | 5.52 |
| Flanders on average | 82.43 | 80.35 | 84.50 | 4.15 | 0.39 | 82.82 | 80.78 | 84.83 | 4.05 |
| Wallonia on average | 79.61 | 77.04 | 82.14 | 5.11 | 0.57 | 80.18 | 77.68 | 82.61 | 4.93 |
Statistics by region
[edit]| Region | 2023 | Historical data | Recovery from COVID-19: 2019→2023 | |||||||||||
|---|---|---|---|---|---|---|---|---|---|---|---|---|---|---|
| All | Male | Female | Sex gap |
2019 | 2019 →2020 |
2020 | 2020 →2021 |
2021 | 2021 →2022 |
2022 | 2022 →2023 |
2023 | ||
| Flanders | 83.17 | 81.26 | 85.03 | 3.77 | 82.70 | −0.70 | 82.00 | 0.68 | 82.68 | −0.06 | 82.62 | 0.55 | 83.17 | 0.47 |
| Belgium | 82.28 | 80.18 | 84.30 | 4.12 | 81.83 | −1.04 | 80.79 | 0.86 | 81.65 | 0.04 | 81.69 | 0.59 | 82.28 | 0.45 |
| Brussels | 82.18 | 79.73 | 84.41 | 4.68 | 81.59 | −1.98 | 79.61 | 1.67 | 81.28 | 0.31 | 81.58 | 0.59 | 82.18 | 0.59 |
| Wallonia | 80.64 | 78.25 | 82.94 | 4.69 | 80.28 | −1.33 | 78.94 | 0.93 | 79.87 | 0.14 | 80.02 | 0.63 | 80.64 | 0.37 |
Data source: Statistics Belgium[1][2]
Eurostat (2019—2022)
[edit]| code | region | 2019 | 2019 →2021 |
2021 | 2021 →2022 |
2022 | 2019 →2022 | ||||||
|---|---|---|---|---|---|---|---|---|---|---|---|---|---|
| overall | male | female | F Δ M | overall | overall | male | female | F Δ M | |||||
| Belgium | 82.1 | 79.8 | 84.3 | 4.5 | −0.2 | 81.9 | −0.1 | 81.8 | 79.7 | 83.9 | 4.2 | −0.3 | |
| BE24 | Flemish Brabant | 83.4 | 81.3 | 85.3 | 4.0 | 0.2 | 83.6 | −0.4 | 83.2 | 81.2 | 85.2 | 4.0 | −0.2 |
| BE22 | Limburg | 83.3 | 81.3 | 85.3 | 4.0 | −0.1 | 83.2 | −0.4 | 82.8 | 81.0 | 84.5 | 3.5 | −0.5 |
| BE21 | Antwerp | 83.0 | 81.2 | 84.7 | 3.5 | −0.1 | 82.9 | −0.1 | 82.8 | 80.9 | 84.6 | 3.7 | −0.2 |
| BE31 | Walloon Brabant | 83.0 | 80.6 | 85.1 | 4.5 | 0.1 | 83.1 | −0.3 | 82.8 | 80.7 | 84.7 | 4.0 | −0.2 |
| BE25 | West Flanders | 83.2 | 80.7 | 85.7 | 5.0 | −0.4 | 82.8 | −0.1 | 82.7 | 80.5 | 84.8 | 4.3 | −0.5 |
| BE23 | East Flanders | 82.6 | 80.2 | 84.9 | 4.7 | 0.1 | 82.7 | −0.1 | 82.6 | 80.6 | 84.6 | 4.0 | 0.0 |
| BE10 | Brussels | 81.6 | 79.1 | 83.9 | 4.8 | −0.2 | 81.4 | 0.2 | 81.6 | 79.1 | 83.9 | 4.8 | 0.0 |
| BE35 | Namur | 80.3 | 77.8 | 82.7 | 4.9 | −0.3 | 80.0 | 0.3 | 80.3 | 77.9 | 82.7 | 4.8 | 0.0 |
| BE34 | Luxembourg | 80.6 | 77.5 | 83.8 | 6.3 | −0.3 | 80.3 | −0.1 | 80.2 | 77.8 | 82.6 | 4.8 | −0.4 |
| BE33 | Liège | 80.6 | 78.5 | 82.5 | 4.0 | −0.5 | 80.1 | −0.1 | 80.0 | 77.9 | 82.0 | 4.1 | −0.6 |
| BE32 | Hainaut | 79.6 | 76.6 | 82.6 | 6.0 | −0.6 | 79.0 | 0.2 | 79.2 | 76.4 | 81.8 | 5.4 | −0.4 |
Global Data Lab (2019–2022)
[edit]| region | 2019 | 2019 →2021 |
2021 | 2021 →2022 |
2022 | 2019 →2022 | ||||||
|---|---|---|---|---|---|---|---|---|---|---|---|---|
| overall | male | female | F Δ M | overall | overall | male | female | F Δ M | ||||
| Belgium on average | 81.83 | 79.60 | 84.00 | 4.40 | 0.05 | 81.88 | 0.41 | 82.29 | 80.16 | 84.37 | 4.21 | 0.46 |
| Flemish Brabant | 83.15 | 81.14 | 85.00 | 3.86 | 0.44 | 83.59 | 0.10 | 83.69 | 81.73 | 85.68 | 3.95 | 0.54 |
| Limburg | 83.05 | 81.14 | 85.00 | 3.86 | 0.14 | 83.19 | 0.09 | 83.28 | 81.53 | 84.98 | 3.45 | 0.23 |
| Antwerp | 82.75 | 81.05 | 84.40 | 3.35 | 0.14 | 82.89 | 0.39 | 83.28 | 81.43 | 85.08 | 3.65 | 0.53 |
| Walloon Brabant | 82.75 | 80.45 | 84.80 | 4.35 | 0.34 | 83.09 | 0.19 | 83.28 | 81.23 | 85.18 | 3.95 | 0.53 |
| West Flanders | 82.95 | 80.55 | 85.40 | 4.85 | −0.16 | 82.79 | 0.39 | 83.18 | 81.03 | 85.28 | 4.25 | 0.23 |
| East Flanders | 82.36 | 80.05 | 84.60 | 4.55 | 0.33 | 82.69 | 0.39 | 83.08 | 81.13 | 85.08 | 3.95 | 0.72 |
| Brussels | 81.36 | 78.95 | 83.60 | 4.65 | 0.03 | 81.39 | 0.69 | 82.08 | 79.62 | 84.37 | 4.75 | 0.72 |
| Namur | 80.06 | 77.65 | 82.41 | 4.76 | −0.07 | 79.99 | 0.78 | 80.77 | 78.41 | 83.17 | 4.76 | 0.71 |
| Belgian Luxembourg | 80.36 | 77.35 | 83.50 | 6.15 | −0.07 | 80.29 | 0.38 | 80.67 | 78.31 | 83.06 | 4.75 | 0.31 |
| Liège | 80.36 | 78.35 | 82.21 | 3.86 | −0.27 | 80.09 | 0.38 | 80.47 | 78.41 | 82.46 | 4.05 | 0.11 |
| Hainaut | 79.37 | 76.45 | 82.31 | 5.86 | −0.38 | 78.99 | 0.67 | 79.66 | 76.90 | 82.26 | 5.36 | 0.29 |
Data source: Global Data Lab[5]
Charts
[edit]-
Development of life expectancy in Belgium according to estimation of the World Bank Group[6]
-
Life expectancy with calculated sex gap[6]
-
Life expectancy in Belgium according to estimation of Our World in Data[7]
-
Development of life expectancy in Belgium in comparison to some European countries[6]
-
Life expectancy and healthy life expectancy in Belgium on the background of other countries of Europe in 2019[8]
-
Life expectancy and healthy life expectancy for males and females separately[8]
See also
[edit]Wikimedia Commons has media related to Life expectancy charts for Belgium.
- List of countries by life expectancy
- List of European countries by life expectancy
- Administrative divisions of Belgium
- Demographics of Belgium
References
[edit]- ^ a b c "Life expectancy". For a healthy Belgium. 15 July 2024. Retrieved 12 August 2024.
- ^ a b c "Life expectancy and life tables". Statistics Belgium. 9 July 2023. Retrieved 12 August 2024.
- ^ a b "Life expectancy at birth by sex and NUTS 2 region". Eurostat. 6 September 2024. Retrieved 22 September 2024. — Dataset
- ^ a b "Life expectancy at birth by sex and NUTS 2 region". Eurostat. 6 September 2024. Retrieved 22 September 2024. — Table. For visualization use tab "Map"
- ^ "Life expectancy 2022 - Maps | Subnational HDI (v8.0)". Global Data Lab. Retrieved 15 October 2024.
- ^ a b c "Life expectancy at birth, total - Belgium". World Bank Group.
- ^ "Life expectancy at birth: Belgium". Our World in Data.
- ^ a b "Life expectancy and Healthy life expectancy, data by country". World Health Organization. 2020. Retrieved 22 January 2024.


![Development of life expectancy in Belgium according to estimation of the World Bank Group[6]](http://upload.wikimedia.org/wikipedia/commons/thumb/4/4e/Life_expectancy_by_WBG_-Belgium.png/431px-Life_expectancy_by_WBG_-Belgium.png)
![Life expectancy with calculated sex gap[6]](http://upload.wikimedia.org/wikipedia/commons/thumb/c/ca/Life_expectancy_by_WBG_-Belgium_-diff.png/360px-Life_expectancy_by_WBG_-Belgium_-diff.png)
![Life expectancy in Belgium according to estimation of Our World in Data[7]](http://upload.wikimedia.org/wikipedia/commons/thumb/d/da/Life_expectancy_in_Belgium.svg/319px-Life_expectancy_in_Belgium.svg.png)
![Development of life expectancy in Belgium in comparison to some European countries[6]](http://upload.wikimedia.org/wikipedia/commons/thumb/b/bb/Life_expectancy_in_some_European_countries.png/355px-Life_expectancy_in_some_European_countries.png)
![Life expectancy and healthy life expectancy in Belgium on the background of other countries of Europe in 2019[8]](http://upload.wikimedia.org/wikipedia/commons/thumb/9/93/Healthy_life_expectancy_bar_chart_-Europe.png/530px-Healthy_life_expectancy_bar_chart_-Europe.png)
![Life expectancy and healthy life expectancy for males and females separately[8]](http://upload.wikimedia.org/wikipedia/commons/thumb/1/13/Healthy_life_expectancy_bar_chart_-Europe_-sex.png/530px-Healthy_life_expectancy_bar_chart_-Europe_-sex.png)