Lingyuan
Appearance
(Redirected from Lingyuan City)
Lingyuan
凌源市 | |
|---|---|
 | |
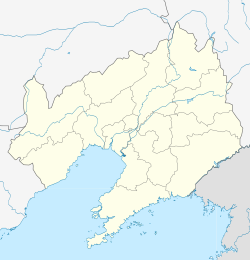
 Location of the city | |
| Coordinates: 41°15′N 119°24′E / 41.250°N 119.400°E | |
| Country | People's Republic of China |
| Province | Liaoning |
| Prefecture-level city | Chaoyang |
| Area | |
| 3,263.0 km2 (1,259.9 sq mi) | |
| • Urban | 462.24 km2 (178.47 sq mi) |
| Elevation | 397 m (1,302 ft) |
| Population (2017)[1] | |
| 646,000 | |
| • Density | 200/km2 (510/sq mi) |
| • Urban | 224,000 |
| Time zone | UTC+8 (China Standard) |
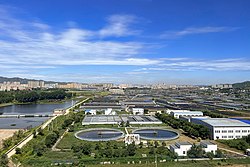
Lingyuan (Chinese: 凌源; pinyin: Língyuán) is a city in the west of Liaoning province in Northeast China, bordering Hebei province and Inner Mongolia. It is under the administration of Chaoyang City, which lies 94 kilometres (58 mi) to the east-northeast.
Administrative Divisions
[edit]There are eight subdistricts, 11 towns, 10 townships, and one ethnic township under the administration of the city.[2]=
Subdistricts:
- Nanjie Subdistrict (南街街道), Beijie Subdistrict (北街街道), Chengguan Town Subdistrict (城关镇街道), Xingyuan Subdistrict (兴源街道), Dongcheng Subdistrict (东城街道), Lingbei Subdistrict (凌北街道), Hongshan Subdistrict (红山街道), Reshuitang Subdistrict (热水汤街道)
Towns:
- Wanyuandian (万元店镇), Songzhangzi (宋杖子镇), Sanshijiazi (三十家子镇), Yangzhangzi (杨杖子镇), Dao'erdeng (刀尔登镇), Songlingzi (松岭子镇), Siguanyingzi (四官营子镇), Goumenzi (沟门子镇), Xiaochengzi (小城子镇), Sihedang (四合当镇), Wulanbai (乌兰白镇)
Townships:
- Liuzhangzi Township (刘杖子乡), Sandaohezi Township (三道河子乡), Niuyingzi Township (牛营子乡), Beilu Township (北炉乡), Hekanzi Township (河坎子乡), Dawangzhangzi Township (大王杖子乡), Foyedong Township (佛爷洞乡), Wafangdian Township (瓦房店乡), Dahebei Township (大河北乡), Qianjin Township (前进乡), Sanjiazi Menggu Ethnic Township (三家子蒙古族乡)
Climate
[edit]| Climate data for Lingyuan, elevation 417 m (1,368 ft), (1991–2020 normals, extremes 1981–2010) | |||||||||||||
|---|---|---|---|---|---|---|---|---|---|---|---|---|---|
| Month | Jan | Feb | Mar | Apr | May | Jun | Jul | Aug | Sep | Oct | Nov | Dec | Year |
| Record high °C (°F) | 12.3 (54.1) |
19.5 (67.1) |
27.0 (80.6) |
33.5 (92.3) |
39.0 (102.2) |
39.0 (102.2) |
43.3 (109.9) |
39.5 (103.1) |
35.2 (95.4) |
30.5 (86.9) |
21.6 (70.9) |
17.3 (63.1) |
43.3 (109.9) |
| Mean daily maximum °C (°F) | −1.4 (29.5) |
2.8 (37.0) |
9.8 (49.6) |
18.3 (64.9) |
25.0 (77.0) |
28.5 (83.3) |
30.1 (86.2) |
29.0 (84.2) |
24.7 (76.5) |
17.1 (62.8) |
7.0 (44.6) |
0.0 (32.0) |
15.9 (60.6) |
| Daily mean °C (°F) | −9.5 (14.9) |
−5.1 (22.8) |
2.4 (36.3) |
11.2 (52.2) |
18.1 (64.6) |
22.1 (71.8) |
24.3 (75.7) |
22.8 (73.0) |
17.3 (63.1) |
9.4 (48.9) |
−0.2 (31.6) |
−7.5 (18.5) |
8.8 (47.8) |
| Mean daily minimum °C (°F) | −15.9 (3.4) |
−11.8 (10.8) |
−4.5 (23.9) |
4.0 (39.2) |
11.0 (51.8) |
16.0 (60.8) |
19.2 (66.6) |
17.5 (63.5) |
10.7 (51.3) |
2.7 (36.9) |
−6.1 (21.0) |
−13.4 (7.9) |
2.5 (36.4) |
| Record low °C (°F) | −29.5 (−21.1) |
−25.2 (−13.4) |
−22.1 (−7.8) |
−8.4 (16.9) |
0.0 (32.0) |
5.4 (41.7) |
11.3 (52.3) |
6.8 (44.2) |
−0.5 (31.1) |
−10.0 (14.0) |
−22.4 (−8.3) |
−27.9 (−18.2) |
−29.5 (−21.1) |
| Average precipitation mm (inches) | 1.5 (0.06) |
1.7 (0.07) |
7.0 (0.28) |
23.4 (0.92) |
46.9 (1.85) |
84.9 (3.34) |
132.6 (5.22) |
89.8 (3.54) |
35.5 (1.40) |
23.2 (0.91) |
10.3 (0.41) |
1.3 (0.05) |
458.1 (18.05) |
| Average precipitation days (≥ 0.1 mm) | 1.8 | 1.3 | 2.8 | 5.3 | 7.3 | 11.5 | 12.8 | 9.6 | 6.6 | 4.5 | 3.0 | 1.4 | 67.9 |
| Average snowy days | 2.2 | 2.5 | 3.0 | 1.3 | 0.1 | 0 | 0 | 0 | 0 | 0.8 | 3.0 | 2.4 | 15.3 |
| Average relative humidity (%) | 48 | 41 | 38 | 38 | 44 | 60 | 71 | 72 | 64 | 55 | 53 | 51 | 53 |
| Mean monthly sunshine hours | 201.6 | 206.4 | 249.9 | 254.7 | 278.8 | 244.2 | 235.7 | 242.1 | 240.2 | 228.5 | 190.1 | 189.2 | 2,761.4 |
| Percent possible sunshine | 68 | 68 | 67 | 63 | 62 | 54 | 52 | 57 | 65 | 67 | 65 | 66 | 63 |
| Source: China Meteorological Administration[3][4] | |||||||||||||
References
[edit]- ^ a b Ministry of Housing and Urban-Rural Development, ed. (2019). China Urban Construction Statistical Yearbook 2017. Beijing: China Statistics Press. p. 50. Retrieved 11 January 2020.
- ^ 朝阳市-行政区划网
- ^ 中国气象数据网 – WeatherBk Data (in Simplified Chinese). China Meteorological Administration. Retrieved 29 July 2023.
- ^ 中国气象数据网 (in Simplified Chinese). China Meteorological Administration. Retrieved 29 July 2023.
External links
[edit]

