Le Verdon-sur-Mer
Le Verdon-sur-Mer | |
|---|---|
 Container ships | |
| Coordinates: 45°32′50″N 1°03′38″W / 45.5472°N 1.0606°W | |
| Country | France |
| Region | Nouvelle-Aquitaine |
| Department | Gironde |
| Arrondissement | Lesparre-Médoc |
| Canton | Le Nord-Médoc |
| Government | |
| • Mayor (2020–2026) | Jacques Bidalun[1] |
Area 1 | 17.09 km2 (6.60 sq mi) |
| Population (2021)[2] | 1,369 |
| • Density | 80/km2 (210/sq mi) |
| Time zone | UTC+01:00 (CET) |
| • Summer (DST) | UTC+02:00 (CEST) |
| INSEE/Postal code | 33544 /33123 |
| Elevation | 0–36 m (0–118 ft) (avg. 6 m or 20 ft) |
| 1 French Land Register data, which excludes lakes, ponds, glaciers > 1 km2 (0.386 sq mi or 247 acres) and river estuaries. | |
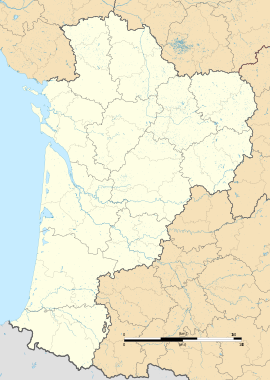
Le Verdon-sur-Mer (French pronunciation: [lə vɛʁdɔ̃ syʁ mɛʁ], literally The Verdon on Sea) is a commune in the Gironde department in Nouvelle-Aquitaine in southwestern France.
History
[edit]In the 11th century, the territory housed the priory of Saint-Nicholas de Grave, dependent on Cluny. It housed the monks in charge of maintaining the fire of Cordouan, off the mouth of the estuary. The priory is buried under the sands for an indefinite period.
Until 1874, the town was dependent on the commune of Soulac. This year was also the year of the construction of the Bordeaux-Le Verdon railway line which would open up the town and envisage a future port. The railway line started from Bordeaux in 1868 and did not reach the town until 1875, with the Point de Grave being reached in 1902.
Le Verdon was initially only a hamlet of Soulac which was a distance from Bourg, which had lived off salt production for a long period of time. The other main activities of the village are the exploitation of resources linked to the sea (fishing, oysters, shellfish, etc.) as well as subsistence farming.
Since the Middle Ages, Le Verdon has been known for its harbor, which is sheltered from prevailing westerly winds. Ships that leave the Gironde estuary park at the harbor before setting sail.
Population
[edit]| Year | Pop. | ±% |
|---|---|---|
| 1962 | 1,554 | — |
| 1968 | 1,630 | +4.9% |
| 1975 | 1,648 | +1.1% |
| 1982 | 1,616 | −1.9% |
| 1990 | 1,344 | −16.8% |
| 1999 | 1,274 | −5.2% |
| 2008 | 1,357 | +6.5% |
See also
[edit]References
[edit]- ^ "Répertoire national des élus: les maires". data.gouv.fr, Plateforme ouverte des données publiques françaises (in French). 2 December 2020.
- ^ "Populations légales 2021" (in French). The National Institute of Statistics and Economic Studies. 28 December 2023.


