Itaberaba
Appearance
Itaberaba | |
|---|---|
Municipality | |
 Regional Airport Itaberaba | |
 | |
| Country | |
| Region | Nordeste |
| State | Bahia |
| Population (2020 [1]) | |
| • Total | 64,646 |
| Time zone | UTC−3 (BRT) |
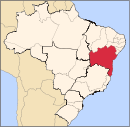
Itaberaba is a municipality in the state of Bahia in the North-East region of Brazil.[2][3][4][5]
The population in 2020 was 64,646.
History
[edit]Before the arrival of Europeans, the area covered by the modern municipality was inhabited by "Maracás Indians" of the "Tapuias" subgroup, believed to have been strong fighters but not cannibals.
In 1768 the São Simão farmstead was established here by Captain Manuel Rodrigues Cajado.
More recently the area has become known as a center for pineapples.
Climate
[edit]| Climate data for Itaberaba (1981–2010) | |||||||||||||
|---|---|---|---|---|---|---|---|---|---|---|---|---|---|
| Month | Jan | Feb | Mar | Apr | May | Jun | Jul | Aug | Sep | Oct | Nov | Dec | Year |
| Mean daily maximum °C (°F) | 33.3 (91.9) |
33.7 (92.7) |
33.0 (91.4) |
31.8 (89.2) |
30.6 (87.1) |
28.7 (83.7) |
28.4 (83.1) |
29.2 (84.6) |
30.8 (87.4) |
32.4 (90.3) |
32.6 (90.7) |
32.7 (90.9) |
31.4 (88.5) |
| Daily mean °C (°F) | 26.4 (79.5) |
26.8 (80.2) |
26.5 (79.7) |
25.6 (78.1) |
24.4 (75.9) |
22.7 (72.9) |
22.1 (71.8) |
22.6 (72.7) |
23.9 (75.0) |
25.2 (77.4) |
25.9 (78.6) |
26.0 (78.8) |
24.8 (76.6) |
| Mean daily minimum °C (°F) | 20.4 (68.7) |
20.9 (69.6) |
20.8 (69.4) |
20.0 (68.0) |
18.5 (65.3) |
16.6 (61.9) |
15.7 (60.3) |
16.3 (61.3) |
17.7 (63.9) |
19.6 (67.3) |
20.3 (68.5) |
20.5 (68.9) |
18.9 (66.0) |
| Average precipitation mm (inches) | 68.3 (2.69) |
61.7 (2.43) |
95.7 (3.77) |
58.7 (2.31) |
32.4 (1.28) |
36.1 (1.42) |
33.3 (1.31) |
20.3 (0.80) |
18.4 (0.72) |
38.5 (1.52) |
74.3 (2.93) |
80.2 (3.16) |
617.9 (24.33) |
| Average precipitation days (≥ 1.0 mm) | 5 | 6 | 8 | 8 | 6 | 8 | 7 | 5 | 4 | 4 | 5 | 5 | 71 |
| Average relative humidity (%) | 65.3 | 65.6 | 68.9 | 71.7 | 72.3 | 74.9 | 72.6 | 68.7 | 67.1 | 65.0 | 66.7 | 67.4 | 68.9 |
| Mean monthly sunshine hours | 226.1 | 211.7 | 219.1 | 192.9 | 177.2 | 150.3 | 169.9 | 183.1 | 192.0 | 202.3 | 185.2 | 195.5 | 2,305.3 |
| Source: Instituto Nacional de Meteorologia[6] | |||||||||||||
See also
[edit]References
[edit]- ^ IBGE 2020
- ^ "Divisão Territorial do Brasil" (in Portuguese). Divisão Territorial do Brasil e Limites Territoriais, Instituto Brasileiro de Geografia e Estatística (IBGE). July 1, 2008. Retrieved December 17, 2009.
- ^ "Estimativas da população para 1º de julho de 2009" (PDF) (in Portuguese). Estimativas de População, Instituto Brasileiro de Geografia e Estatística (IBGE). August 14, 2009. Retrieved December 17, 2009.
- ^ "Ranking decrescente do IDH-M dos municípios do Brasil" (in Portuguese). Atlas do Desenvolvimento Humano, Programa das Nações Unidas para o Desenvolvimento (PNUD). 2000. Archived from the original on October 3, 2009. Retrieved December 17, 2009.
- ^ "Produto Interno Bruto dos Municípios 2002-2005" (PDF) (in Portuguese). Instituto Brasileiro de Geografia e Estatística (IBGE). December 19, 2007. Archived from the original (PDF) on October 2, 2008. Retrieved December 17, 2009.
- ^ "Normais Climatológicas Do Brasil 1981–2010" (in Portuguese). Instituto Nacional de Meteorologia. Retrieved 21 May 2024.


