Jump to content

Iowa's 3rd congressional district

Coordinates: 41°12′34″N 94°38′25″W / 41.20944°N 94.64028°W / 41.20944; -94.64028
From Wikipedia, the free encyclopedia

Iowa's 3rd congressional district
Map
Interactive map of district boundaries since January 3, 2023
Representative
Distribution
  • 73.07% urban
  • 26.93% rural
Population (2023)821,239
Median household
income
$77,054[1]
Ethnicity
Cook PVIR+3[2]

Iowa's 3rd congressional district is a congressional district in the U.S. state of Iowa that covers its southwestern quadrant, which roughly consists of an area stretching from Des Moines to the borders with Missouri.

From 2013 to 2023, the district covered the southwestern corner of the state, from the Des Moines metropolitan area on the northeastern end to the greater Council Bluffs area on the southwestern end.

The district has been represented in the United States House of Representatives by Republican Zach Nunn since 2023. With a Cook Partisan Voting Index rating of R+3, it is the equal least Republican leaning district (along with the 1st) of Iowa’s four congressional districts, a state currently represented in Congress only by Republicans.[2]. It is also the wealthiest congressional district in the state of Iowa. [3]

Statewide races since 2000

[edit]

Election results from statewide races:

Office Year District result Winner
Statewide Nationwide
President 2000 Al Gore 49% – George W. Bush 48% Gore Bush
2004 George W. Bush 50% – John Kerry 50% Bush
2008 Barack Obama 54% – John McCain 44% Obama Obama
2012 Barack Obama 51% – Mitt Romney 47%
2016 Donald J. Trump 48% – Hillary Clinton 45% Trump Trump
2020 Donald J. Trump 49.1% – Joe Biden 49.0% Biden

Composition

[edit]

The 3rd districts includes the entirety of the following counties:

# County Seat Population
1 Adair Greenfield 7,389
3 Adams Corning 3,544
7 Appanoose Centerville 12,119
29 Cass Atlantic 13,130
39 Clarke Osceola 9,588
49 Dallas Adel 111,092
51 Davis Bloomfield 9,169
53 Decatur Leon 7,665
73 Greene Jefferson 8,584
77 Guthrie Guthrie Center 10,722
117 Lucas Chariton 8,747
121 Madison Winterset 16,971
135 Monroe Albia 7,504
137 Montgomery Red Oak 10,139
145 Page Clarinda 15,014
153 Polk Des Moines 505,255
159 Ringgold Mount Ayr 4,642
173 Taylor Bedford 5,924
175 Union Creston 11,906
179 Wapello Ottumwa 35,166
185 Wayne Corydon 6,557

List of members representing the district

[edit]
Representative Party Years Cong
ress
Electoral history Location
District created March 4, 1863

William B. Allison
(Dubuque)
Republican March 4, 1863 –
March 3, 1871
38th
39th
40th
41st
Elected in 1862.
Re-elected in 1864.
Re-elected in 1866.
Re-elected in 1868.
Retired to run for U.S. Senator.
1863–1873
[data missing]

William G. Donnan
(Independence)
Republican March 4, 1871 –
March 3, 1875
42nd
43rd
Elected in 1870.
Re-elected in 1872.
Retired.
1873–1883
[data missing]

Lucien L. Ainsworth
(West Union)
Democratic March 4, 1875 –
March 3, 1877
44th Elected in 1874.
Retired.

Theodore W. Burdick
(Decorah)
Republican March 4, 1877 –
March 3, 1879
45th Elected in 1876.
Retired.

Thomas Updegraff
(McGregor)
Republican March 4, 1879 –
March 3, 1883
46th
47th
Elected in 1878.
Re-elected in 1880.
Redistricted to the 4th district and lost re-election there.

David B. Henderson
(Dubuque)
Republican March 4, 1883 –
March 3, 1903
48th
49th
50th
51st
52nd
53rd
54th
55th
56th
57th
Elected in 1882.
Re-elected in 1884.
Re-elected in 1886.
Re-elected in 1888.
Re-elected in 1890.
Re-elected in 1892.
Re-elected in 1894.
Re-elected in 1896.
Re-elected in 1898.
Re-elected in 1900.
Renominated but withdrew prior to election.
1883–1887
Black Hawk, Bremer, Buchanan, Butler, Delaware, Dubuque, and Grundy counties
1887–1933
Black Hawk, Bremer, Buchanan, Butler, Delaware, Dubuque, Franklin, Hardin, and Wright counties

Benjamin P. Birdsall
(Clarion)
Republican March 4, 1903 –
March 3, 1909
58th
59th
60th
Elected in 1902.
Re-elected in 1904.
Re-elected in 1906.
Retired.

Charles E. Pickett
(Waterloo)
Republican March 4, 1909 –
March 3, 1913
61st
62nd
Elected in 1908.
Re-elected in 1910.
Lost re-election.

Maurice Connolly
(Dubuque)
Democratic March 4, 1913 –
March 3, 1915
63rd Elected in 1912.
Retired to run for U.S. Senator.

Burton E. Sweet
(Waverly)
Republican March 4, 1915 –
March 3, 1923
64th
65th
66th
67th
Elected in 1914.
Re-elected in 1916.
Re-elected in 1918.
Re-elected in 1920.
Retired to run for U.S. Senator.

Thomas J. B. Robinson
(Hampton)
Republican March 4, 1923 –
March 3, 1933
68th
69th
70th
71st
72nd
Elected in 1922.
Re-elected in 1924.
Re-elected in 1926.
Re-elected in 1928.
Re-elected in 1930.
Lost re-election.

Albert C. Willford
(Waterloo)
Democratic March 4, 1933 –
January 3, 1935
73rd Elected in 1932.
Lost re-election.
1933–1943
[data missing]

John W. Gwynne
(Waterloo)
Republican January 3, 1935 –
January 3, 1949
74th
75th
76th
77th
78th
79th
80th
Elected in 1934.
Re-elected in 1936.
Re-elected in 1938.
Re-elected in 1940.
Re-elected in 1942.
Re-elected in 1944.
Re-elected in 1946.
Lost renomination.
1943–1963
[data missing]

Harold R. Gross
(Waterloo)
Republican January 3, 1949 –
January 3, 1975
81st
82nd
83rd
84th
85th
86th
87th
88th
89th
90th
91st
92nd
93rd
Elected in 1948.
Re-elected in 1950.
Re-elected in 1952.
Re-elected in 1954.
Re-elected in 1956.
Re-elected in 1958.
Re-elected in 1960.
Re-elected in 1962.
Re-elected in 1964.
Re-elected in 1966.
Re-elected in 1968.
Re-elected in 1970.
Re-elected in 1972.
Retired.
1963–1973
[data missing]
1973–1983
[data missing]

Chuck Grassley
(New Hartford)
Republican January 3, 1975 –
January 3, 1981
94th
95th
96th
Elected in 1974.
Re-elected in 1976.
Re-elected in 1978.
Retired to run for U.S. Senator.

T. Cooper Evans
(Grundy Center)
Republican January 3, 1981 –
January 3, 1987
97th
98th
99th
Elected in 1980.
Re-elected in 1982.
Re-elected in 1984.
Retired.
1983–1993
[data missing]

David R. Nagle
(Cedar Rapids)
Democratic January 3, 1987 –
January 3, 1993
100th
101st
102nd
Elected in 1986.
Re-elected in 1988.
Re-elected in 1990.
Redistricted to the 2nd district and lost re-election.

Jim R. Lightfoot
(Shenandoah)
Republican January 3, 1993 –
January 3, 1997
103rd
104th
Redistricted from the 5th district and re-elected in 1992.
Re-elected in 1994.
Retired to run for U.S. Senator.
1993–2003
[data missing]

Leonard Boswell
(Des Moines)
Democratic January 3, 1997 –
January 3, 2013
105th
106th
107th
108th
109th
110th
111th
112th
Elected in 1996.
Re-elected in 1998.
Re-elected in 2000.
Re-elected in 2002.
Re-elected in 2004.
Re-elected in 2006.
Re-elected in 2008.
Re-elected in 2010.
Lost re-election.
2003–2013

Tom Latham
(Clive)
Republican January 3, 2013 –
January 3, 2015
113th Redistricted from the 4th district and re-elected in 2012.
Retired.
2013–2023

David Young
(Van Meter)
Republican January 3, 2015 –
January 3, 2019
114th
115th
Elected in 2014.
Re-elected in 2016.
Lost re-election.

Cindy Axne
(West Des Moines)
Democratic January 3, 2019 –
January 3, 2023
116th
117th
Elected in 2018.
Re-elected in 2020.
Lost re-election.

Zach Nunn
(Bondurant)
Republican January 3, 2023 –
present
118th Elected in 2022 2023–present:

Recent election results

[edit]
Year[4] Winner Second Percentage
Party affiliation Candidate Votes Party affiliation Candidate Votes
1920 Republican Burton E. Sweet 67,859 Farmer–Labor Roy Jacobs 1,974 97% – 3%
1922 Thomas J. B. Robinson 34,518 Democratic Fred P. Hageman 24,304 58% – 41%
1924 54,921 Willis N. Birdsall 25,215 69% – 31%
1926 32,180 Ellis E. Wilson 13,696 70% – 30%
1928 60,025 Leo. F. Tierney 38,469 61% – 39%
1930 27,098 W. L. Beecher 15,908 63% – 37%
1932 Democratic Albert C. Willford 48,939 Republican Thomas J. B. Robinson 47,776 51% – 49%
1934 Republican John W. Gwynne 42,063 Democratic Albert C. Willford 35,159 51% – 43%
1936 53,928 47,391 52% – 46%
1938 45,541 W. F. Hayes 30,158 60% – 40%
1940 65,425 Ernest J. Seemann 43,709 60% – 40%
1942 54,124 William D. Kearney 35,065 61% – 39%
1944 74,901 56,985 58% – 42%
1946 48,346 Dan J. P. Ryan 29,661 62% – 38%
1948 H. R. Gross 78,838 56,002 58% – 41%
1950 73,490 James O. Babcock 40,786 64% – 36%
1952 109,992 George R. Laub 56,871 66% – 34%
1954 68,307 41,622 62% – 38%
1956 97,590 Michael Micich 69,076 59% – 41%
1958 61,920 53,467 54% – 46%
1960 99,046 Edward J. Gallagher, Jr. 76,837 56% – 44%
1962 66,337 Neel F. Hill 50,580 57% – 43%
1964 83,455 Stephen M. Peterson 83,036 50.1% – 49.9%
1966 79,343 L. A. Pat Touchae 48,530 62% – 38%
1968 101,839 John E. Van Eschen 57,164 64% – 36%
1970 66,087 Lyle D. Taylor 45,958 59% – 41%
1972 109,113 86,848 56% – 44%
1974 Chuck Grassley 77,468 Stephen Rapp 74,859 51% – 49%
1976 117,957 90,981 56% – 44%
1978 103,659 John Knudson 34,880 75% – 25%
1980 T. Cooper Evans 107,869 Lynn G. Cutler 101,735 51% – 48%
1982 104,072 83,581 55% – 45%
1984 133,737 Joe Johnston 86,574 61% – 39%
1986 Democratic David R. Nagle 83,504 Republican John McIntee 69,386 55% – 45%
1988 129,204 Donald B. Redfern 74,682 63% – 37%
1990 100,947 unopposed 833 99% – 1%
1992 Republican Jim Ross Lightfoot 125,931 Democratic Elaine Baxter 121,063 49% – 47%
1994 111,862 79,310 58% – 41%
1996 Democratic Leonard Boswell 115,914 Republican Mike Mahaffey 111,895 49% – 48%
1998 107,947 Larry McKibben 78,063 57% – 41%
2000 156,327 Jay Marcus 83,810 63% – 34%
2002 115,367 Stan Thompson 97,285 53% – 45%
2004 168,007 136,099 55% – 45%
2006 114,689 Jeff Lamberti 103,182 52% – 47%
2008 175,423 Kim Schmett 131,524 56% – 42%
2010 122,147 Brad Zaun 111,925 50% – 46%
2012 Republican Tom Latham 202,000 Democratic Leonard Boswell 168,632 51% – 42%
2014 David Young 148,814 Staci Appel 119,109 52% – 42%
2016 208,598 Jim Mowrer 155,002 53% – 40%
2018 Democratic Cindy Axne 169,888 Republican David Young 164,667 49% – 47%
2020 219,205 212,997 49% – 48%
2022 Republican Zach Nunn 156,237 Democratic Cindy Axne 154,084 50% – 49%

2002

[edit]
2002 Iowa's 3rd congressional district election
Party Candidate Votes %
Democratic Leonard Boswell* 115,367 53.41
Republican Stan Thompson 97,285 45.04
Libertarian Jeffrey J. Smith 2,689 1.25
Socialist Workers Edwin B. Fruit 569 0.26
No party Others 75 0.04
Total votes 215,985 100.00
Turnout  
Democratic hold

2004

[edit]
2004 Iowa's 3rd congressional district election
Party Candidate Votes %
Democratic Leonard Boswell* 168,007 55.21
Republican Stan Thompson 136,009 44.72
No party Others 213 0.07
Total votes 304,229 100.00
Turnout  
Democratic hold

2006

[edit]
2006 Iowa's 3rd congressional district election
Party Candidate Votes %
Democratic Leonard Boswell* 115,769 51.85
Republican Jeff Lamberti 103,722 46.45
Socialist Workers Helen Meyers 3,591 1.61
No party Others 205 0.09
Total votes 223,287 100.00
Turnout  
Democratic hold

2008

[edit]
2008 Iowa's 3rd congressional district election
Party Candidate Votes %
Democratic Leonard Boswell* 176,904 56.31
Republican Kim Schmett 132,136 42.06
Socialist Workers Frank Forrestal 4,599 1.46
No party Others 521 0.17
Total votes 314,160 100.00
Turnout  
Democratic hold

2010

[edit]
2010 Iowa's 3rd congressional district election
Party Candidate Votes %
Democratic Leonard Boswell* 122,147 50.73
Republican Brad Zaun 111,925 46.49
Socialist Workers Rebecca Williamson 6,258 2.60
No party Others 426 0.18
Total votes 240,756 100.00
Turnout  
Democratic hold

2012

[edit]
2012 Iowa's 3rd congressional district election
Party Candidate Votes %
Republican Tom Latham* 202,000 50.56
Democratic Leonard Boswell* 168,632 42.20
Independent Scott G. Batcher 9,352 2.34
Socialist Workers David Rosenfeld 6,286 1.57
No party Others 572 0.14
Total votes 399,561 100.00
Turnout  
Republican gain from Democratic

2014

[edit]
2014 Iowa's 3rd congressional district election
Party Candidate Votes %
Republican David Young 148,814 52.8
Democratic Staci Appel 119,109 42.2
Libertarian Edward Wright 9,054 3.2
No party preference Bryan Jack Holder 4,360 1.5
Write-ins 729 0.3
Total votes 282,066 100
Republican hold

2016

[edit]
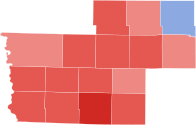
Map showing the results of the 2016 election in Iowa's 3rd congressional district by county
2016 Iowa's 3rd congressional district election
Party Candidate Votes %
Republican David Young* 208,598 53.45
Democratic Jim Mowrer 155,002 39.71
Libertarian Bryan Jack Holder 15,372 3.94
Nominated by Petition Claudia Addy 6,348 1.63
Nominated by Petition Joe Grandanette 4,518 1.16
Write-ins 449 0.12
Total votes 390,287 100.00
Republican hold

2018

[edit]
Results of the 2018 Iowa's 3rd congressional district election
2018 Iowa's 3rd congressional district election[5]
Party Candidate Votes % ±%
Democratic Cindy Axne 169,888 49.0 +9.29
Republican David Young* 164,667 47.49 −5.96
Libertarian Bryan Jack Holder 7,005 2.02 −1.92
Legal Marijuana Now Mark Elworth, Jr. 1,906 0.55 +0.55
Green Paul Knupp 1,795 0.52 +0.52
Independent Joe Grandanette 1,271 0.37 −0.79
Write-ins 178 0.05 +0.00
Plurality 5,221 1.51
Turnout 346,710 100
Democratic gain from Republican Swing +15.25

2020

[edit]
Results of the 2020 Iowa's 3rd congressional district election
2020 Iowa's 3rd congressional district election[6]
Party Candidate Votes %
Democratic Cindy Axne (incumbent) 219,205 48.9
Republican David Young 212,997 47.6
Libertarian Bryan Jack Holder 15,361 3.4
Write-in 384 0.1
Total votes 447,947 100.0
Democratic hold

2022

[edit]
2022 Iowa's 3rd congressional district election
Party Candidate Votes %
Republican Zach Nunn 156,237 50.3%
Democratic Cindy Axne (incumbent) 154,084 49.6%
Write-in 534 0.2%
Total votes 310,855 100%
Republican gain from Democratic

See also

[edit]

References

[edit]
General
  1. ^ "My Congressional District".
  2. ^ a b "2022 Cook PVI: District Map and List". Cook Political Report. July 12, 2022. Retrieved January 10, 2023.
  3. ^ Andrew DePietro (October 1, 2024). "The Richest Congressional Districts In Every State Of 2024". Forbes.
  4. ^ "Election Statistics". 2005. Archived from the original on July 25, 2007.
  5. ^ "Iowa General Election 2018". Iowa Secretary of State. Retrieved November 11, 2018.
  6. ^ "General Election - 2020 Canvass Summary" (PDF). Iowa Secretary of State.
Specific
U.S. House of Representatives
Preceded by Home district of the speaker of the House
December 4, 1899 – March 4, 1903
Succeeded by


41°12′34″N 94°38′25″W / 41.20944°N 94.64028°W / 41.20944; -94.64028