1924 South Australian state election
Appearance
| ||||||||||||||||||||||||||||||||||
All 46 seats in the South Australian House of Assembly 24 seats were needed for a majority | ||||||||||||||||||||||||||||||||||
|---|---|---|---|---|---|---|---|---|---|---|---|---|---|---|---|---|---|---|---|---|---|---|---|---|---|---|---|---|---|---|---|---|---|---|
| ||||||||||||||||||||||||||||||||||
| ||||||||||||||||||||||||||||||||||
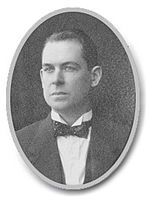
State elections were held in South Australia on 5 April 1924. All 46 seats in the South Australian House of Assembly were up for election. The incumbent Liberal Federation government led by Premier of South Australia Henry Barwell was defeated by the opposition Australian Labor Party led by Leader of the Opposition John Gunn. Each district elected multiple members, with voters casting multiple votes.
The Farmers and Settlers Association became known as the Country Party from this election.
Results
[edit]|
South Australian state election, 5 April 1924[1] | ||||||
|---|---|---|---|---|---|---|
| Enrolled voters | 289,843 | |||||
| Votes cast | 161,165 | Turnout | 62.71% | -1.06% | ||
| Informal votes | 1,774 | Informal | N/A | |||
| Summary of votes by party | ||||||
| Party | Primary votes | % | Swing | Seats | Change | |
| Labor | 192,256 | 48.35% | +3.73% | 27 | + 11 | |
| Liberal Federation | 165,802 | 41.70% | +6.80% | 17 | - 8 | |
| Country | 35,551 | 8.94% | +8.94% | 2 | + 2 | |
| Independents | 1,827 | 0.46% | -3.10% | 0 | 0 | |
| Votes for other parties | 2,176 | 0.55% | +0.55% | 0 | 0 | |
| Total | 397,612 | 46 | ||||
See also
[edit]- Results of the South Australian state election, 1924 (House of Assembly)
- Candidates of the South Australian state election, 1924
- Members of the South Australian House of Assembly, 1924–1927
- Members of the South Australian Legislative Council, 1924–1927
References
[edit]- ^ "Summary of 1924 Election". University of Western Australia. Retrieved 7 July 2015.
- History of South Australian elections 1857-2006, volume 1: ECSA
- State and federal election results in Australia since 1890


