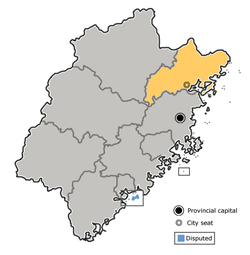
Zherong
Appearance
Zherong County
柘荣县 | |
|---|---|
 Zherong in Ningde | |
 Ningde in Fujian | |
| Coordinates: 27°14′02″N 119°54′02″E / 27.2339°N 119.9006°E | |
| Country | People's Republic of China |
| Province | Fujian |
| Prefecture-level city | Ningde |
| Area | |
• Total | 548.0 km2 (211.6 sq mi) |
| Population (2020) | |
• Total | 92,989 |
| • Density | 170/km2 (440/sq mi) |
| Time zone | UTC+8 (China Standard) |
Zherong County (simplified Chinese: 柘荣县; traditional Chinese: 柘榮縣; pinyin: Zhèróng Xiàn; Foochow Romanized: Ciá-ìng-gâing) is a county in the northeast of Fujian province, People's Republic of China, bordering Zhejiang province to the north.[1] It is under the administration of the prefecture-level city of Ningde.
Administrative divisions
[edit]Towns:[2]
- Shuangcheng (双城镇), Fuxi (富溪镇)
Townships:
- Chengjiao Township (城郊乡), Zhayang Township (乍洋乡), Dongyuan Township (东源乡), Zhaizhong Township (宅中乡), Huangbai Township (黄柏乡), Chuping Township (楮坪乡), Yingshan Township (英山乡)
Climate
[edit]| Climate data for Zherong, elevation 684 m (2,244 ft), (1991–2020 normals, extremes 1981–2010) | |||||||||||||
|---|---|---|---|---|---|---|---|---|---|---|---|---|---|
| Month | Jan | Feb | Mar | Apr | May | Jun | Jul | Aug | Sep | Oct | Nov | Dec | Year |
| Record high °C (°F) | 23.1 (73.6) |
27.4 (81.3) |
30.6 (87.1) |
31.3 (88.3) |
33.3 (91.9) |
34.5 (94.1) |
36.0 (96.8) |
35.0 (95.0) |
34.8 (94.6) |
32.1 (89.8) |
30.9 (87.6) |
25.3 (77.5) |
36.0 (96.8) |
| Mean daily maximum °C (°F) | 11.5 (52.7) |
13.0 (55.4) |
16.2 (61.2) |
21.2 (70.2) |
24.7 (76.5) |
27.4 (81.3) |
30.5 (86.9) |
29.8 (85.6) |
26.6 (79.9) |
22.3 (72.1) |
18.0 (64.4) |
13.5 (56.3) |
21.2 (70.2) |
| Daily mean °C (°F) | 6.3 (43.3) |
7.6 (45.7) |
10.8 (51.4) |
15.7 (60.3) |
19.6 (67.3) |
23.0 (73.4) |
25.5 (77.9) |
24.8 (76.6) |
21.9 (71.4) |
17.5 (63.5) |
13.2 (55.8) |
8.2 (46.8) |
16.2 (61.1) |
| Mean daily minimum °C (°F) | 2.9 (37.2) |
4.1 (39.4) |
6.9 (44.4) |
11.5 (52.7) |
15.8 (60.4) |
19.8 (67.6) |
21.8 (71.2) |
21.3 (70.3) |
18.6 (65.5) |
13.9 (57.0) |
9.6 (49.3) |
4.6 (40.3) |
12.6 (54.6) |
| Record low °C (°F) | −7.1 (19.2) |
−5.8 (21.6) |
−4.8 (23.4) |
0.7 (33.3) |
5.8 (42.4) |
10.0 (50.0) |
16.3 (61.3) |
16.3 (61.3) |
9.1 (48.4) |
1.8 (35.2) |
−2.6 (27.3) |
−9.8 (14.4) |
−9.8 (14.4) |
| Average precipitation mm (inches) | 67.7 (2.67) |
94.4 (3.72) |
161.2 (6.35) |
153.3 (6.04) |
197.8 (7.79) |
322.8 (12.71) |
267.7 (10.54) |
367.3 (14.46) |
224.7 (8.85) |
85.0 (3.35) |
71.3 (2.81) |
62.7 (2.47) |
2,075.9 (81.76) |
| Average precipitation days (≥ 0.1 mm) | 14.6 | 15.1 | 18.7 | 17.2 | 18.2 | 19.2 | 15.0 | 19.1 | 15.3 | 10.1 | 11.6 | 12.2 | 186.3 |
| Average snowy days | 2.0 | 2.0 | 0.6 | 0.1 | 0 | 0 | 0 | 0 | 0 | 0 | 0 | 0.5 | 5.2 |
| Average relative humidity (%) | 81 | 82 | 81 | 78 | 80 | 83 | 79 | 81 | 81 | 77 | 80 | 78 | 80 |
| Mean monthly sunshine hours | 105.0 | 95.9 | 108.2 | 128.3 | 126.4 | 125.0 | 207.0 | 179.0 | 142.4 | 151.0 | 113.2 | 120.7 | 1,602.1 |
| Percent possible sunshine | 32 | 30 | 29 | 33 | 30 | 30 | 49 | 44 | 39 | 43 | 35 | 37 | 36 |
| Source: China Meteorological Administration[3][4] | |||||||||||||
References
[edit]- ^ "Níngdé Shì (Prefecture-level City, China) - Population Statistics, Charts, Map and Location". www.citypopulation.de. Retrieved 2024-10-30.
- ^ "宁德市-行政区划网 www.xzqh.org" (in Chinese). XZQH. Retrieved 2012-05-24.
- ^ 中国气象数据网 – WeatherBk Data (in Simplified Chinese). China Meteorological Administration. Retrieved 23 June 2023.
- ^ 中国气象数据网 (in Simplified Chinese). China Meteorological Administration. Retrieved 23 June 2023.
