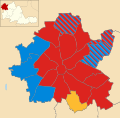
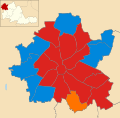
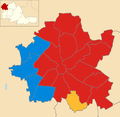
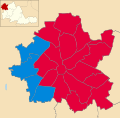
City of Wolverhampton Council elections
Appearance
(Redirected from Wolverhampton City Council elections)
City of Wolverhampton Council elections are held three years out of every four, with a third of the council elected each time. City of Wolverhampton Council is the local authority for the metropolitan borough of Wolverhampton in the West Midlands, England. Since the boundary changes in 2004, 60 councillors have been elected from 20 wards.[1]

Council elections
[edit]- 1973 Wolverhampton Metropolitan Borough Council election
- 1975 Wolverhampton Metropolitan Borough Council election
- 1976 Wolverhampton Metropolitan Borough Council election
- 1978 Wolverhampton Metropolitan Borough Council election
- 1979 Wolverhampton Metropolitan Borough Council election
- 1980 Wolverhampton Metropolitan Borough Council election
- 1982 Wolverhampton Metropolitan Borough Council election
- 1983 Wolverhampton Metropolitan Borough Council election
- 1984 Wolverhampton Metropolitan Borough Council election
- 1986 Wolverhampton Metropolitan Borough Council election
- 1987 Wolverhampton Metropolitan Borough Council election
- 1988 Wolverhampton Metropolitan Borough Council election
- 1990 Wolverhampton Metropolitan Borough Council election
- 1991 Wolverhampton Metropolitan Borough Council election
- 1992 Wolverhampton Metropolitan Borough Council election
- 1994 Wolverhampton Metropolitan Borough Council election
- 1995 Wolverhampton Metropolitan Borough Council election
- 1996 Wolverhampton Metropolitan Borough Council election
- 1998 Wolverhampton Metropolitan Borough Council election
- 1999 Wolverhampton Metropolitan Borough Council election
- 2000 Wolverhampton Metropolitan Borough Council election
- 2002 Wolverhampton City Council election
- 2003 Wolverhampton City Council election
- 2004 Wolverhampton City Council election (new ward boundaries)[1]
- 2006 Wolverhampton City Council election
- 2007 Wolverhampton City Council election
- 2008 Wolverhampton City Council election
- 2010 Wolverhampton City Council election
- 2011 Wolverhampton City Council election
- 2012 Wolverhampton City Council election
- 2014 Wolverhampton City Council election
- 2015 Wolverhampton City Council election
- 2016 City of Wolverhampton Council election
- 2018 City of Wolverhampton Council election
- 2019 City of Wolverhampton Council election
- 2021 City of Wolverhampton Council election
- 2022 City of Wolverhampton Council election
- 2023 City of Wolverhampton Council election (new ward boundaries)[2]
- 2024 City of Wolverhampton Council election
Borough result maps
[edit]-
2004 results map
-
2006 results map
-
2007 results map
-
2008 results map
-
2010 results map
-
2011 results map
-
2012 results map
-
2014 results map
-
2015 results map
-
2016 results map
-
2018 results map
-
2019 results map
-
2021 results map
-
2022 results map
-
2023 results map
-
2024 results map
By-election results
[edit]1994–1998
[edit]| Party | Candidate | Votes | % | ±% | |
|---|---|---|---|---|---|
| Labour | Greg Brackenridge | 1,172 | 63.8 | ||
| Liberal Democrats | 437 | 23.8 | |||
| Conservative | Peter O'Connell | 227 | 12.4 | ||
| Majority | 735 | 40.0 | |||
| Turnout | 1,836 | 22.8 | |||
| Labour hold | Swing | ||||
| Party | Candidate | Votes | % | ±% | |
|---|---|---|---|---|---|
| Labour | Alan Smith | 949 | 72.9 | −5.1 | |
| Conservative | Simon Jevon | 223 | 17.1 | +0.7 | |
| Liberal Democrats | 130 | 10.0 | +4.3 | ||
| Majority | 726 | 55.8 | |||
| Turnout | 1,302 | 16.1 | |||
| Labour hold | Swing | ||||
| Party | Candidate | Votes | % | ±% | |
|---|---|---|---|---|---|
| Conservative | Robert Hart | 1,395 | 51.7 | +3.6 | |
| Labour | 1,003 | 37.2 | −5.3 | ||
| Liberal Democrats | 298 | 11.1 | +1.6 | ||
| Majority | 392 | 14.5 | |||
| Turnout | 2,696 | ||||
| Conservative gain from Labour | Swing | ||||
1998–2002
[edit]| Party | Candidate | Votes | % | ±% | |
|---|---|---|---|---|---|
| Labour | 941 | 46.9 | −2.9 | ||
| Conservative | 841 | 41.9 | +2.4 | ||
| Liberal Democrats | 225 | 11.2 | +11.2 | ||
| Majority | 100 | 5.0 | |||
| Turnout | 2,007 | ||||
| Labour hold | Swing | ||||
2002–2006
[edit]| Party | Candidate | Votes | % | ±% | |
|---|---|---|---|---|---|
| Conservative | Jonathan Yardley | 1,279 | 62.5 | +0.1 | |
| Liberal Democrats | Ian Jenkins | 431 | 21.0 | +7.3 | |
| Labour | Michael Stafford | 338 | 16.5 | −7.4 | |
| Majority | 848 | 41.5 | |||
| Turnout | 2,048 | 22.5 | |||
| Conservative hold | Swing | ||||
2006–2010
[edit]| Party | Candidate | Votes | % | ±% | |
|---|---|---|---|---|---|
| Conservative | Neil Clarke | 1,295 | 45.3 | +0.1 | |
| Labour | David Jones | 1,072 | 37.5 | +3.0 | |
| BNP | Dennis Organ | 337 | 11.8 | −3.6 | |
| Liberal Democrats | Ian Jenkins | 156 | 5.5 | +0.5 | |
| Majority | 223 | 7.8 | |||
| Turnout | 2,860 | 31.7 | |||
| Conservative hold | Swing | ||||
| Party | Candidate | Votes | % | ±% | |
|---|---|---|---|---|---|
| Conservative | Peter Dobb | 1,123 | 45.2 | −16.1 | |
| Labour | Mike Hardacre | 867 | 34.9 | +8.0 | |
| BNP | David Bradnock | 358 | 14.4 | +14.4 | |
| Liberal Democrats | John Steatham | 134 | 5.4 | −1.4 | |
| Majority | 256 | 10.3 | |||
| Turnout | 2,482 | 28.5 | |||
| Conservative hold | Swing | ||||
| Party | Candidate | Votes | % | ±% | |
|---|---|---|---|---|---|
| Labour | Milkinderpal Jaspal | 621 | 49.1 | +3.1 | |
| Conservative | Madeleine Wilson | 497 | 39.3 | −14.8 | |
| Liberal Democrats | Stephen Birch | 147 | 11.6 | +11.6 | |
| Majority | 124 | 9.8 | |||
| Turnout | 1,265 | 17.2 | |||
| Labour hold | Swing | ||||
| Party | Candidate | Votes | % | ±% | |
|---|---|---|---|---|---|
| Labour | Sandra Samuels | 1,274 | 58.8 | +0.3 | |
| Conservative | Arun Photay | 449 | 20.7 | −3.8 | |
| Liberal Democrats | Stephanie Kerrigan | 366 | 16.9 | −0.1 | |
| Independent | Jaswinder Tinsa | 77 | 3.6 | +3.6 | |
| Majority | 825 | 38.1 | |||
| Turnout | 2,166 | 25.2 | |||
| Labour hold | Swing | ||||
2010–2014
[edit]| Party | Candidate | Votes | % | ±% | |
|---|---|---|---|---|---|
| Labour | Linda Leach | 1,292 | |||
| Conservative | Marlene Berry | 460 | |||
| BNP | Stewart Gardner | 131 | |||
| UKIP | Barry Hodgson | 55 | |||
| Liberal Democrats | Darren Friel | 52 | |||
| Majority | 832 | ||||
| Turnout | 1,993 | 22.3 | |||
| Labour gain from Conservative | Swing | ||||
| Party | Candidate | Votes | % | ±% | |
|---|---|---|---|---|---|
| Labour | Jacqueline Sweetman | 1,527 | 64.7 | +0.2 | |
| Conservative | John Mellor | 591 | 25.0 | +8.5 | |
| Liberal Democrats | Eileen Birch | 177 | 7.5 | +2.1 | |
| UKIP | Don Cooper | 65 | 2.8 | +2.8 | |
| Majority | 936 | 39.7 | |||
| Turnout | 2,369 | 28.2 | |||
| Labour hold | Swing | -4.2 | |||
| Party | Candidate | Votes | % | ±% | |
|---|---|---|---|---|---|
| Labour | Craig Collingswood | 1,023 | 58.0 | ||
| Conservative | Jenny Brewer | 482 | 27.3 | ||
| Liberal Democrats | Roger Gray | 179 | 10.1 | ||
| UKIP | Don Cooper | 81 | 4.6 | ||
| Majority | 538 | ||||
| Turnout | 1,815 | ||||
| Labour hold | Swing | - | |||
| Party | Candidate | Votes | % | ±% | |
|---|---|---|---|---|---|
| Labour | Harbans Singh Bagri | 1,934 | 76.5 | −9.2 | |
| UKIP | David Mackintosh | 263 | 10.4 | +10.4 | |
| Conservative | Stephen Dion | 242 | 9.6 | −4.7 | |
| Liberal Democrats | Eileen Birch | 89 | 3.5 | ||
| Majority | 1,671 | 66.1 | |||
| Turnout | 2,528 | ||||
| Labour hold | Swing | - | |||
2022–2026
[edit]| Party | Candidate | Votes | % | ±% | |
|---|---|---|---|---|---|
| Labour | Lovinyer Daley | 783 | 65.52 | ||
| Conservative | Steve Hall | 412 | 32.48 | ||
| Majority | 371 | 32.94 | |||
| Turnout | 1,195 | 13.18 | |||
| Labour hold | Swing | ||||
| Party | Candidate | Votes | % | ±% | |
|---|---|---|---|---|---|
| Labour | Paul Brookfield | 686 | 59.2 | −5.4 | |
| Conservative | Rob Williams | 256 | 22.1 | −0.5 | |
| Liberal Democrats | Ian Jenkins | 139 | 12.0 | −0.8 | |
| Green | Mohammed Naseem | 78 | 6.7 | +6.7 | |
| Majority | 430 | 37.1 | |||
| Turnout | 1,159 | ||||
| Labour hold | Swing | ||||
| Party | Candidate | Votes | % | ±% | |
|---|---|---|---|---|---|
| Reform UK | Anita Stanley | 652 | 34.8 | New | |
| Labour | Luke Matthew Guy | 471 | 25.2 | −46.1 | |
| Green | Hardev Singh | 438 | 23.4 | New | |
| Conservative | Andrew Randle | 257 | 13.7 | −15.0 | |
| Liberal Democrats | Julian Martin Donald | 55 | 2.9 | New | |
| Majority | 181 | 9.7 | |||
| Turnout | 1,873 | 19.2 | |||
| Reform UK gain from Labour | Swing | ||||
References
[edit]- ^ a b "The City of Wolverhampton (Electoral Changes) Order 2003", legislation.gov.uk, The National Archives, SI 2003/2509, retrieved 13 September 2022
- ^ "Polling District Review Consultation - City of Wolverhampton Council - Citizen Space". consultation.wolverhampton.gov.uk. Retrieved 1 April 2023.
- ^ "Tettenhall Regis Ward By-Election Results – 13 March 2003". Wolverhampton City Council. Archived from the original on 12 June 2011. Retrieved 30 August 2009.
- ^ a b "Tories hold 'scandal' seats". Birmingham Mail. 24 October 2008. p. 3.
- ^ a b "By Election Results – 23 October 2008". Wolverhampton City Council. Archived from the original on 12 June 2011. Retrieved 30 August 2009.
- ^ "Results – Heath Town by-election". Wolverhampton City Council. Archived from the original on 12 June 2011. Retrieved 30 August 2009.
- ^ "Results – Ettingshall by-election, March 26, 2009". Wolverhampton City Council. Archived from the original on 12 June 2011. Retrieved 30 August 2009.
- ^ "Bilston North by-election, July 29, 2010". Wolverhampton City Council. Archived from the original on 5 February 2012. Retrieved 19 September 2011.
- ^ "Graiseley by-election, September 15, 2011". Wolverhampton City Council. Archived from the original on 5 February 2012. Retrieved 19 September 2011.
- ^ "Local Elections Archive Project — Park Ward". www.andrewteale.me.uk. Retrieved 17 April 2022.
- ^ "Local Elections Archive Project — Blakenhall Ward". www.andrewteale.me.uk. Retrieved 18 March 2024.
- ^ "Local Elections Archive Project — East Park Ward". www.andrewteale.me.uk. Retrieved 17 April 2022.
- ^ "Bushbury South and Low Hill by-election - Thursday 28 September". www.wolverhampton.gov.uk. Retrieved 29 September 2023.
- ^ "Bilston North Ward by Election". www.wolverhampton.gov.uk. Retrieved 2 November 2024.
- Wolverhampton election results
- By-election results Archived 29 March 2010 at the Wayback Machine

