User:Maproom/Image formats: raster or vector?
A comparison of image formats
[edit]This page considers various image formats accepted by Wikipedia Commons. The examples used are all map images, but the views expressed here apply to all images.
Wikipedia accepts images in numerous file formats. The most common of these are .PNG, .GIF, .BMP and .JPEG, which are all "bitmap" or "raster" formats, and .SVG, a "vector" format. The difference between the two types is that a raster-format file contains information about the color of each pixel in the image, while a vector-format image contains information specifying the shapes that make up the image.
Wikipedia policy is that the vector format SVG is preferable to raster formats.[citation needed]. A procedure for converting a raster image to SVG is given at Wikipedia:Graphics_Lab/Resources/PDF conversion to SVG (a rather strange name for the page, as it isn't about converting PDF files). I believe that the policy is misguided. The purpose of this page is to explain why.
Why it matters
[edit]
It doesn't make much difference what format a single image is stored in. It does matter when an image needs to be adapted, or used as material for constructing a new image.
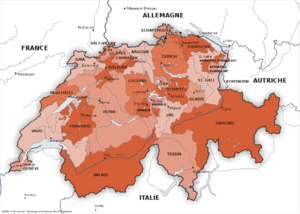
A specimen image is shown to the right. As it is, it does its job well, and this has little to do with its format. But the format matters if there is a need to adapt it. For example:
The image has its text in French. We need an English-language version of it.
[edit]If it's a well-constructed SVG file, this will be easy. Load the file into a text editor, search for the string "ALLEMAGNE", and replace it by "GERMANY"; etc. This is very easy.
If it's in a raster format, we load the image into a graphics editor, remove the French-language text (an easy but tedious process), repair the rivers and other topographic features which have been damaged by the removal of text (which can be quite tricky), and add the new text (easy).
The article Sonderbund War needs a map showing the religious majority in each canton. We want to take this image and re-color it accordingly
[edit]If it's a well-constructed SVG file, this will depend on the file structure – it may be rather difficult, or it may be almost impossible. If we want Grisons to be half-green half-orange, it will be difficult.
If it's in a raster format, we load the image into a graphics editor, select "green", select "flood-fill", and click on each Catholic canton. We will have to click repeatedly to do each piece of each canton, as separated by rivers, text, etc. This is rather tedious, but easy. If we want Grisons to be half-green half-orange, we use a graphics "draw" tool to draw the dividing line in grey first, this is easy.
