User:Jdbtwo/sandbox/Mandel1


The Mandelbrot set is the set of complex numbers for which the function does not diverge when iterated from , i.e., for which the sequence , , etc., remains bounded in absolute value.

Its definition is credited to Adrien Douady who named it in tribute to the mathematician Benoit Mandelbrot.[1] The set is connected to a Julia set, and related Julia sets produce similarly complex fractal shapes.
Mandelbrot set images may be created by sampling the complex numbers and testing, for each sample point , whether the sequence goes to infinity (in practice — whether it leaves some predetermined bounded neighborhood of 0 after a predetermined number of iterations). Treating the real and imaginary parts of as image coordinates on the complex plane, pixels may then be coloured according to how soon the sequence crosses an arbitrarily chosen threshold, with a special color (usually black) used for the values of for which the sequence has not crossed the threshold after the predetermined number of iterations (this is necessary to clearly distinguish the Mandelbrot set image from the image of its complement). If is held constant and the initial value of —denoted by —is variable instead, one obtains the corresponding Julia set for each point in the parameter space of the simple function.
Images of the Mandelbrot set exhibit an elaborate and infinitely complicated boundary that reveals progressively ever-finer recursive detail at increasing magnifications. The "style" of this repeating detail depends on the region of the set being examined. The set's boundary also incorporates smaller versions of the main shape, so the fractal property of self-similarity applies to the entire set, and not just to its parts.
The Mandelbrot set has become popular outside mathematics both for its aesthetic appeal and as an example of a complex structure arising from the application of simple rules. It is one of the best-known examples of mathematical visualization and mathematical beauty.
History
[edit]
The Mandelbrot set has its origin in complex dynamics, a field first investigated by the French mathematicians Pierre Fatou and Gaston Julia at the beginning of the 20th century. This fractal was first defined and drawn in 1978 by Robert W. Brooks and Peter Matelski as part of a study of Kleinian groups.[2] On 1 March 1980, at IBM's Thomas J. Watson Research Center in Yorktown Heights, New York, Benoit Mandelbrot first saw a visualization of the set.[3]
Mandelbrot studied the parameter space of quadratic polynomials in an article that appeared in 1980.[4] The mathematical study of the Mandelbrot set really began with work by the mathematicians Adrien Douady and John H. Hubbard,[1] who established many of its fundamental properties and named the set in honor of Mandelbrot for his influential work in fractal geometry.
The mathematicians Heinz-Otto Peitgen and Peter Richter became well known for promoting the set with photographs, books,[5] and an internationally touring exhibit of the German Goethe-Institut.[6][7]
The cover article of the August 1985 Scientific American introduced a wide audience to the algorithm for computing the Mandelbrot set. The cover featured an image located at -0.909 + -0.275 and was created by Peitgen, et al.[8][9] The Mandelbrot set became prominent in the mid-1980s as a computer graphics demo, when personal computers became powerful enough to plot and display the set in high resolution.[10]
The work of Douady and Hubbard coincided with a huge increase in interest in complex dynamics and abstract mathematics, and the study of the Mandelbrot set has been a centerpiece of this field ever since. An exhaustive list of all who have contributed to the understanding of this set since then is long but would include Mikhail Lyubich,[11][12] Curt McMullen, John Milnor, Mitsuhiro Shishikura and Jean-Christophe Yoccoz.
Formal definition
[edit]The Mandelbrot set is the set of values of c in the complex plane for which the orbit of 0 under iteration of the quadratic map
remains bounded.[13] Thus, a complex number c is a member of the Mandelbrot set if, when starting with z0 = 0 and applying the iteration repeatedly, the absolute value of zn remains bounded for all n>0.
For example, for c=1, the sequence is 0, 1, 2, 5, 26, ..., which tends to infinity, so 1 is not an element of the Mandelbrot set. On the other hand, for c=−1, the sequence is 0, −1, 0, −1, 0, ..., which is bounded, so −1 does belong to the set.

The Mandelbrot set can also be defined as the connectedness locus of a family of polynomials.
Basic properties
[edit]The Mandelbrot set is a compact set, since it is closed and contained in the closed disk of radius 2 around the origin. More specifically, a point belongs to the Mandelbrot set if and only if
- for all
In other words, if the absolute value of ever becomes larger than 2, the sequence will escape to infinity.


The intersection of with the real axis is precisely the interval [−2, 1/4]. The parameters along this interval can be put in one-to-one correspondence with those of the real logistic family,
The correspondence is given by
In fact, this gives a correspondence between the entire parameter space of the logistic family and that of the Mandelbrot set.
Douady and Hubbard have shown that the Mandelbrot set is connected. In fact, they constructed an explicit conformal isomorphism between the complement of the Mandelbrot set and the complement of the closed unit disk. Mandelbrot had originally conjectured that the Mandelbrot set is disconnected. This conjecture was based on computer pictures generated by programs that are unable to detect the thin filaments connecting different parts of . Upon further experiments, he revised his conjecture, deciding that should be connected. There also exists a topological proof to the connectedness that was discovered in 2001 by Jeremy Kahn.[14]

The dynamical formula for the uniformisation of the complement of the Mandelbrot set, arising from Douady and Hubbard's proof of the connectedness of , gives rise to external rays of the Mandelbrot set. These rays can be used to study the Mandelbrot set in combinatorial terms and form the backbone of the Yoccoz parapuzzle.[15]
The boundary of the Mandelbrot set is exactly the bifurcation locus of the quadratic family; that is, the set of parameters for which the dynamics changes abruptly under small changes of It can be constructed as the limit set of a sequence of plane algebraic curves, the Mandelbrot curves, of the general type known as polynomial lemniscates. The Mandelbrot curves are defined by setting p0 = z, pn+1 = pn2 + z, and then interpreting the set of points |pn(z)| = 2 in the complex plane as a curve in the real Cartesian plane of degree 2n+1 in x and y. These algebraic curves appear in images of the Mandelbrot set computed using the "escape time algorithm" mentioned below.
Other properties
[edit]Main cardioid and period bulbs
[edit]
Upon looking at a picture of the Mandelbrot set, one immediately notices the large cardioid-shaped region in the center. This main cardioid is the region of parameters for which has an attracting fixed point. It consists of all parameters of the form
for some in the open unit disk.
To the left of the main cardioid, attached to it at the point , a circular-shaped bulb is visible. This bulb consists of those parameters for which has an attracting cycle of period 2. This set of parameters is an actual circle, namely that of radius 1/4 around −1.
There are infinitely many other bulbs tangent to the main cardioid: for every rational number , with p and q coprime, there is such a bulb that is tangent at the parameter
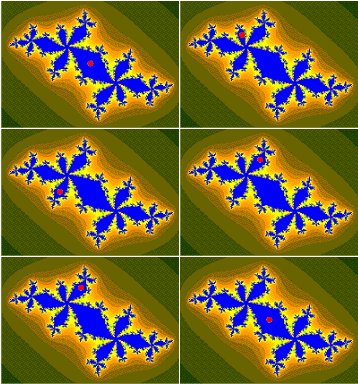
This bulb is called the -bulb of the Mandelbrot set. It consists of parameters that have an attracting cycle of period and combinatorial rotation number . More precisely, the periodic Fatou components containing the attracting cycle all touch at a common point (commonly called the -fixed point). If we label these components in counterclockwise orientation, then maps the component to the component .

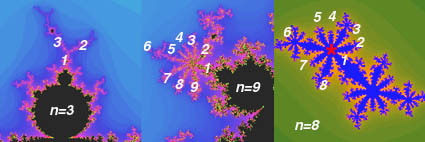
The change of behavior occurring at is known as a bifurcation: the attracting fixed point "collides" with a repelling period q-cycle. As we pass through the bifurcation parameter into the -bulb, the attracting fixed point turns into a repelling fixed point (the -fixed point), and the period q-cycle becomes attracting.
Hyperbolic components
[edit]All the bulbs we encountered in the previous section were interior components of the Mandelbrot set in which the maps have an attracting periodic cycle. Such components are called hyperbolic components.
It is conjectured that these are the only interior regions of . This problem, known as density of hyperbolicity, may be the most important open problem in the field of complex dynamics. Hypothetical non-hyperbolic components of the Mandelbrot set are often referred to as "queer" or ghost components.[16][17] For real quadratic polynomials, this question was answered positively in the 1990s independently by Lyubich and by Graczyk and Świątek. (Note that hyperbolic components intersecting the real axis correspond exactly to periodic windows in the Feigenbaum diagram. So this result states that such windows exist near every parameter in the diagram.)
Not every hyperbolic component can be reached by a sequence of direct bifurcations from the main cardioid of the Mandelbrot set. However, such a component can be reached by a sequence of direct bifurcations from the main cardioid of a little Mandelbrot copy (see below).
Each of the hyperbolic components has a center, which is a point c such that the inner Fatou domain for has a super-attracting cycle – that is, that the attraction is infinite (see the image here). This means that the cycle contains the critical point 0, so that 0 is iterated back to itself after some iterations. We therefore have that n for some n. If we call this polynomial (letting it depend on c instead of z), we have that and that the degree of is . We can therefore construct the centers of the hyperbolic components by successively solving the equations . The number of new centers produced in each step is given by Sloane's OEIS: A000740.
Local connectivity
[edit]

It is conjectured that the Mandelbrot set is locally connected. This famous conjecture is known as MLC (for Mandelbrot locally connected). By the work of Adrien Douady and John H. Hubbard, this conjecture would result in a simple abstract "pinched disk" model of the Mandelbrot set. In particular, it would imply the important hyperbolicity conjecture mentioned above.
The work of Jean-Christophe Yoccoz established local connectivity of the Mandelbrot set at all finitely renormalizable parameters; that is, roughly speaking those contained only in finitely many small Mandelbrot copies.[18] Since then, local connectivity has been proved at many other points of , but the full conjecture is still open.
Self-similarity
[edit]

The Mandelbrot set is self-similar under magnification in the neighborhoods of the Misiurewicz points. It is also conjectured to be self-similar around generalized Feigenbaum points (e.g., −1.401155 or −0.1528 + 1.0397i), in the sense of converging to a limit set.[19][20]

The Mandelbrot set in general is not strictly self-similar but it is quasi-self-similar, as small slightly different versions of itself can be found at arbitrarily small scales.
The little copies of the Mandelbrot set are all slightly different, mostly because of the thin threads connecting them to the main body of the set.
Further results
[edit]The Hausdorff dimension of the boundary of the Mandelbrot set equals 2 as determined by a result of Mitsuhiro Shishikura.[21] It is not known whether the boundary of the Mandelbrot set has positive planar Lebesgue measure.
In the Blum-Shub-Smale model of real computation, the Mandelbrot set is not computable, but its complement is computably enumerable. However, many simple objects (e.g., the graph of exponentiation) are also not computable in the BSS model. At present, it is unknown whether the Mandelbrot set is computable in models of real computation based on computable analysis, which correspond more closely to the intuitive notion of "plotting the set by a computer". Hertling has shown that the Mandelbrot set is computable in this model if the hyperbolicity conjecture is true.

Relationship with Julia sets
[edit]As a consequence of the definition of the Mandelbrot set, there is a close correspondence between the geometry of the Mandelbrot set at a given point and the structure of the corresponding Julia set. For instance, a point is in the Mandelbrot set exactly when the corresponding Julia set is connected.
This principle is exploited in virtually all deep results on the Mandelbrot set. For example, Shishikura proved that, for a dense set of parameters in the boundary of the Mandelbrot set, the Julia set has Hausdorff dimension two, and then transfers this information to the parameter plane.[21] Similarly, Yoccoz first proved the local connectivity of Julia sets, before establishing it for the Mandelbrot set at the corresponding parameters.[18] Adrien Douady phrases this principle as:
Plough in the dynamical plane, and harvest in parameter space.
Geometry
[edit]
For every rational number , where p and q are relatively prime, a hyperbolic component of period q bifurcates from the main cardioid. The part of the Mandelbrot set connected to the main cardioid at this bifurcation point is called the p/q-limb. Computer experiments suggest that the diameter of the limb tends to zero like . The best current estimate known is the Yoccoz-inequality, which states that the size tends to zero like .
A period-q limb will have q − 1 "antennae" at the top of its limb. We can thus determine the period of a given bulb by counting these antennas.
Pi in the Mandelbrot set
[edit]In an attempt to demonstrate that the thickness of the p/q-limb is zero, David Boll carried out a computer experiment in 1991, where he computed the number of iterations required for the series to diverge for z = ( being the location thereof). As the series doesn't diverge for the exact value of z = , the number of iterations required increases with a small ε. It turns out that multiplying the value of ε with the number of iterations required yields an approximation of π that becomes better for smaller ε. For example, for ε = 0.0000001 the number of iterations is 31415928 and the product is 3.1415928.[22]
Fibonacci sequence in the Mandelbrot set
[edit]It can be shown that the Fibonacci sequence is located within the Mandelbrot Set and that a relation exists between the main cardioid and the Farey Diagram. Upon mapping the main cardioid to a disk, one can notice that the amount of antennae that extends from the next largest Hyperbolic component, and that is located between the two previously selected components, follows suit with the Fibonacci sequence. The amount of antennae also correlates with the Farey Diagram and the denominator amounts within the corresponding fractional values, of which relate to the distance around the disk. Both portions of these fractional values themselves can be summed together after to produce the location of the next Hyperbolic component within the sequence. Thus, the Fibonacci sequence of 1, 2, 3, 5, 8, 13, and 21 can be found within the Mandelbrot set.
Image gallery of a zoom sequence
[edit]The Mandelbrot set shows more intricate detail the closer one looks or magnifies the image, usually called "zooming in". The following example of an image sequence zooming to a selected c value gives an impression of the infinite richness of different geometrical structures and explains some of their typical rules.
The magnification of the last image relative to the first one is about 1010 to 1. Relating to an ordinary monitor, it represents a section of a Mandelbrot set with a diameter of 4 million kilometers. Its border would show an astronomical number of different fractal structures.
-
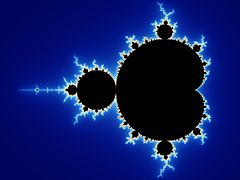
Start. Mandelbrot set with continuously colored environment.
-
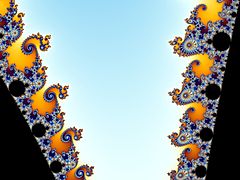
Gap between the "head" and the "body", also called the "seahorse valley"
-
Double-spirals on the left, "seahorses" on the right
-
"Seahorse" upside down
The seahorse "body" is composed by 25 "spokes" consisting of two groups of 12 "spokes" each and one "spoke" connecting to the main cardioid. These two groups can be attributed by some kind of metamorphosis to the two "fingers" of the "upper hand" of the Mandelbrot set; therefore, the number of "spokes" increases from one "seahorse" to the next by 2; the "hub" is a so-called Misiurewicz point. Between the "upper part of the body" and the "tail" a distorted small copy of the Mandelbrot set called satellite may be recognized.
-
The central endpoint of the "seahorse tail" is also a Misiurewicz point.
-
Part of the "tail" — there is only one path consisting of the thin structures that lead through the whole "tail". This zigzag path passes the "hubs" of the large objects with 25 "spokes" at the inner and outer border of the "tail"; thus the Mandelbrot set is a simply connected set, which means there are no islands and no loop roads around a hole.
-
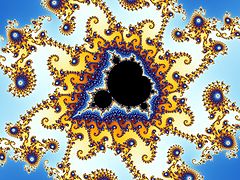
Satellite. The two "seahorse tails" are the beginning of a series of concentric crowns with the satellite in the center. Open this location in an interactive viewer.
-
Each of these crowns consists of similar "seahorse tails"; their number increases with powers of 2, a typical phenomenon in the environment of satellites. The unique path to the spiral center passes the satellite from the groove of the cardioid to the top of the "antenna" on the "head".
-
"Antenna" of the satellite. Several satellites of second order may be recognized.
-
The "seahorse valley" of the satellite. All the structures from the start of the zoom reappear.
-
Double-spirals and "seahorses" – unlike the 2nd image from the start, they have appendices consisting of structures like "seahorse tails"; this demonstrates the typical linking of n + 1 different structures in the environment of satellites of the order n, here for the simplest case n = 1.
-
Double-spirals with satellites of second order – analogously to the "seahorses", the double-spirals may be interpreted as a metamorphosis of the "antenna"
-
In the outer part of the appendices, islands of structures may be recognized; they have a shape like Julia sets Jc; the largest of them may be found in the center of the "double-hook" on the right side
-
Part of the "double-hook"
-
Islands
-
Detail of one island
-
Detail of the spiral. Open this location in an interactive viewer.
The islands above seem to consist of infinitely many parts like Cantor sets, as is[clarification needed] actually the case for the corresponding Julia set Jc. However, they are connected by tiny structures, so that the whole represents a simply connected set. The tiny structures meet each other at a satellite in the center that is too small to be recognized at this magnification. The value of c for the corresponding Jc is not that of the image center but, relative to the main body of the Mandelbrot set, has the same position as the center of this image relative to the satellite shown in the 6th zoom step.
3D images of Mandelbrot and Julia sets
[edit]This section needs additional citations for verification. (January 2020) |
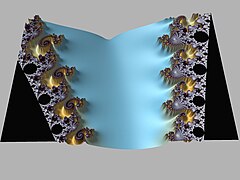
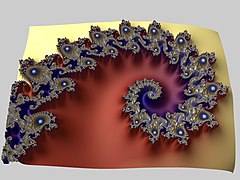
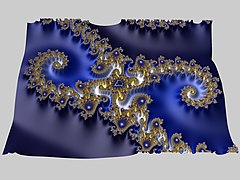
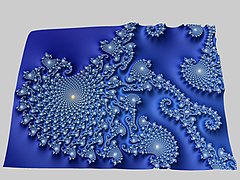
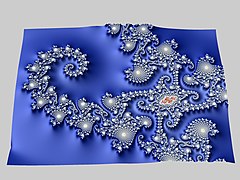
In addition to creating two dimensional images of the Mandelbrot set, various techniques can be used to render Mandelbrot and Julia sets as 3D Heightmap images, where each pixel in a 2D image is given a height value, and the resulting image is rendered as a 3D graphic.
The simplest approach to 3D rendering uses the iteration value for each pixel as a height value. This produces images with distinct "steps" in the height value.

If instead you use the fractional iteration value (also known as the potential function[23] to calculate the height value for each point, you avoid steps in the resulting image. However, images rendered in 3D using fractional iteration data still look rather bumpy and visually noisy.

An alternative approach is to use Distance Estimate[24] (DE) data for each point to calculate a height value. Non-linear mapping of distance estimate value using an exponential function can produce visually pleasing images. Images plotted using DE data are often visually striking, and more importantly, the 3D shape makes it easy to visualize the thin "tendrils" that connect points of the set. Color plates 29 and 30 on page 121 of "The Science of Fractal Images" show a 2D and 3D image plotted using External Distance Estimates.

Below is a 3D version of the "Image gallery of a zoom sequence" gallery above, rendered as height maps using Distance Estimate data, and using similar cropping and coloring.
-
Zoom 00. Start. Mandelbrot set with continuously colored environment.
-
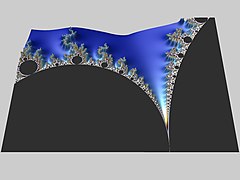
Zoom 01. Gap between the "head" and the "body", also called the "seahorse valley"
-
Zoom 02. Double-spirals on the left, "seahorses" on the right
-
Zoom 03. "Seahorse" upside down
-
Zoom 04. A "seahorse tail".
-
Zoom 05. Part of the "tail".
-
Zoom 06. Satellite with twin "Seahorse tails."
-
Zoom 07. Satellite closeup.
-
Zoom 08. "Antenna" of the satellite. Several satellites of second order may be recognized.
-
Zoom 09. The "seahorse valley" of the satellite. All the structures from the start of the zoom reappear.
-
Zoom 10. Double-spirals and "seahorses"
-
Zoom 11. Double-spirals with satellites of second order.
-
Zoom 13. Part of the "double-hook"
-
Zoom 14. Islands
-
Zoom 15. Detail of one island
-
Zoom 16. Detail of the spiral.
The image below is similar to "zoom 5", above, but is an attempt to create a 3D version of the image "Map 44" from page 85 of the book "The Beauty of Fractals"[25] using a visually similar color scheme that shows the details of the plot in 3D.

Generalizations
[edit]
Multibrot sets
[edit]Multibrot sets are bounded sets found in the complex plane for members of the general monic univariate polynomial family of recursions
For an integer d, these sets are connectedness loci for the Julia sets built from the same formula. The full cubic connectedness locus has also been studied; here one considers the two-parameter recursion , whose two critical points are the complex square roots of the parameter k. A parameter is in the cubic connectedness locus if both critical points are stable.[26] For general families of holomorphic functions, the boundary of the Mandelbrot set generalizes to the bifurcation locus, which is a natural object to study even when the connectedness locus is not useful.
The Multibrot set is obtained by varying the value of the exponent d. The article has a video that shows the development from d = 0 to 7, at which point there are 6 i.e. (d − 1) lobes around the perimeter. A similar development with negative exponents results in (1 − d) clefts on the inside of a ring.
Higher dimensions
[edit]There is no perfect extension of the Mandelbrot set into 3D. This is because there is no 3D analogue of the complex numbers for it to iterate on. However, there is an extension of the complex numbers into 4 dimensions, called the quaternions, that creates a perfect extension of the Mandelbrot set and the Julia sets into 4 dimensions.[27] These can then be either cross-sectioned or projected into a 3D structure.
Other, non-analytic, mappings
[edit]

Of particular interest is the tricorn fractal, the connectedness locus of the anti-holomorphic family
The tricorn (also sometimes called the Mandelbar) was encountered by Milnor in his study of parameter slices of real cubic polynomials. It is not locally connected. This property is inherited by the connectedness locus of real cubic polynomials.
Another non-analytic generalization is the Burning Ship fractal, which is obtained by iterating the following :
Computer drawings
[edit]

There are many programs and algorithms used to generate the Mandelbrot set and other fractals, some of which are described in fractal-generating software. These programs use a variety of algorithms to determine the color of individual pixels and achieve efficient computation.
One of the simplest algorithms used to plot the Mandelbrot set on a computer is called the "escape time algorithm". In the escape time algorithm, a repeating calculation is performed for each x, y point in the plot area and based on the behavior of that calculation, a color is chosen for that pixel.
The x and y locations of each point are used as starting values in a repeating, or iterating calculation (described in detail below). The result of each iteration is used as the starting values for the next. The values are checked during each iteration to see whether they have reached a critical "escape" condition, or "bailout". If that condition is reached, the calculation is stopped, the pixel is drawn, and the next x, y point is examined.
The color of each point represents how quickly the values reached the escape point. Often black is used to show values that fail to escape before the iteration limit, and gradually brighter colors are used for points that escape. This gives a visual representation of how many cycles were required before reaching the escape condition.
To render such an image, the region of the complex plane we are considering is subdivided into a certain number of pixels. To color any such pixel, let be the midpoint of that pixel. We now iterate the critical point 0 under , checking at each step whether the orbit point has modulus larger than 2. When this is the case, we know that does not belong to the Mandelbrot set, and we color our pixel according to the number of iterations used to find out. Otherwise, we keep iterating up to a fixed number of steps, after which we decide that our parameter is "probably" in the Mandelbrot set, or at least very close to it, and color the pixel black.
In pseudocode, this algorithm would look as follows. The algorithm does not use complex numbers and manually simulates complex-number operations using two real numbers, for those who do not have a complex data type. The program may be simplified if the programming language includes complex-data-type operations.
for each pixel (Px, Py) on the screen do
    x0 = scaled x coordinate of pixel (scaled to lie in the Mandelbrot X scale (-2.5, 1))
    y0 = scaled y coordinate of pixel (scaled to lie in the Mandelbrot Y scale (-1, 1))
    x := 0.0
    y := 0.0
    iteration := 0
    max_iteration := 1000
    while (x×x + y×y ≤ 2×2 AND iteration < max_iteration) do
        xtemp := x×x - y×y + x0
        y := 2×x×y + y0
        x := xtemp
        iteration := iteration + 1

    color := palette[iteration]
    plot(Px, Py, color)
Here, relating the pseudocode to , and :
and so, as can be seen in the pseudocode in the computation of x and y:
- and
To get colorful images of the set, the assignment of a color to each value of the number of executed iterations can be made using one of a variety of functions (linear, exponential, etc.).
References in popular culture
[edit]The Mandelbrot set is considered by many the most popular fractal,[28][29] and has been referenced several times in popular culture.
- The Jonathan Coulton song "Mandelbrot Set" is a tribute to both the fractal itself and to its discoverer Benoit Mandelbrot.[30]
- The second book of the Mode series by Piers Anthony, Fractal Mode, describes a world that is a perfect 3D model of the set.[31]
- The Arthur C. Clarke novel The Ghost from the Grand Banks features an artificial lake made to replicate the shape of the Mandelbrot set.[32]
See also
[edit]- Buddhabrot
- Collatz fractal
- Fractint
- Gilbreath permutation
- Mandelbox
- Mandelbulb
- Menger Sponge
- Newton fractal
- Orbit portrait
- Orbit trap
- Pickover stalk
References
[edit]- ^ a b Adrien Douady and John H. Hubbard, Etude dynamique des polynômes complexes, Prépublications mathémathiques d'Orsay 2/4 (1984 / 1985)
- ^ Robert Brooks and Peter Matelski, The dynamics of 2-generator subgroups of PSL(2,C), in Irwin Kra (1 May 1981). Irwin Kra (ed.). Riemann Surfaces and Related Topics: Proceedings of the 1978 Stony Brook Conference (PDF). Bernard Maskit. Princeton University Press. ISBN 0-691-08267-7.
- ^ R.P. Taylor & J.C. Sprott (2008). "Biophilic Fractals and the Visual Journey of Organic Screen-savers" (PDF). Nonlinear Dynamics, Psychology, and Life Sciences, Vol. 12, No. 1. Society for Chaos Theory in Psychology & Life Sciences. Retrieved 1 January 2009.
- ^ Benoit Mandelbrot, Fractal aspects of the iteration of for complex , Annals of the New York Academy of Sciences 357, 249/259
- ^ Peitgen, Heinz-Otto; Richter Peter (1986). The Beauty of Fractals. Heidelberg: Springer-Verlag. ISBN 0-387-15851-0.
- ^ Frontiers of Chaos, Exhibition of the Goethe-Institut by H.O. Peitgen, P. Richter, H. Jürgens, M. Prüfer, D.Saupe. since 1985 shown in over 40 countries.
- ^ Gleick, James (1987). Chaos: Making a New Science. London: Cardinal. p. 229.
- ^ Dewdney, A. K. (1985). "Computer Recreations, August 1985; A computer microscope zooms in for a look at the most complex object in mathematics" (PDF). Scientific American.
- ^ John Briggs (1992). Fractals: The Patterns of Chaos. p. 80.
- ^ Pountain, Dick (September 1986). "Turbocharging Mandelbrot". Byte. Retrieved 11 November 2015.
- ^ Lyubich, Mikhail (May–June 1999). "Six Lectures on Real and Complex Dynamics". Retrieved 4 April 2007.
{{cite journal}}: Cite journal requires|journal=(help) - ^ Lyubich, Mikhail (November 1998). "Regular and stochastic dynamics in the real quadratic family" (PDF). Proceedings of the National Academy of Sciences of the United States of America. 95 (24): 14025–14027. Bibcode:1998PNAS...9514025L. doi:10.1073/pnas.95.24.14025. PMC 24319. PMID 9826646. Retrieved 4 April 2007.
- ^ "Mandelbrot Set Explorer: Mathematical Glossary". Retrieved 7 October 2007.
- ^ Kahn, Jeremy (8 August 2001). "The Mandelbrot Set is Connected: a Topological Proof" (PDF).
- ^ The Mandelbrot set, theme and variations. Tan, Lei. Cambridge University Press, 2000. ISBN 978-0-521-77476-5. Section 2.1, "Yoccoz para-puzzles", p. 121
- ^ Exploring the Mandelbrot set. The Orsay Notes by Adrien Douady and John H. Hubbard. page 12
- ^ Wolf Jung, March 2002, Homeomorphisms on Edges of the Mandelbrot Set by Wolf Jung
- ^ a b Hubbard, J. H. (1993), "Local connectivity of Julia sets and bifurcation loci: three theorems of J.-C. Yoccoz" (PDF), Topological methods in modern mathematics (Stony Brook, NY, 1991), Houston, TX: Publish or Perish, pp. 467–511, MR 1215974. Hubbard cites as his source a 1989 unpublished manuscript of Yoccoz.
- ^ Lei (1990). "Similarity between the Mandelbrot set and Julia Sets". Communications in Mathematical Physics. 134 (3): 587–617. Bibcode:1990CMaPh.134..587L. doi:10.1007/bf02098448.
- ^ J. Milnor (1989). "Self-Similarity and Hairiness in the Mandelbrot Set". In M. C. Tangora (ed.). Computers in Geometry and Topology. New York: Taylor & Francis. pp. 211–257.)
- ^ a b Shishikura, Mitsuhiro (1998), "The Hausdorff dimension of the boundary of the Mandelbrot set and Julia sets", Annals of Mathematics, Second Series, 147 (2): 225–267, arXiv:math.DS/9201282, doi:10.2307/121009, JSTOR 121009, MR 1626737.
- ^ Gary William Flake, The Computational Beauty of Nature, 1998. p. 125. ISBN 978-0-262-56127-3.
- ^ potential function)
- ^ Peitgen, Heinz-Otto; Saupe Dietmar (1988). The Science of Fractal Images. New York: Springer-Verlag. pp. 121, 196–197. ISBN 0-387-96608-0.
- ^ Peitgen, Heinz-Otto; Richter Peter (1986). The Beauty of Fractals. Heidelberg: Springer-Verlag. p. 85. ISBN 0-387-15851-0.
- ^ Rudy Rucker's discussion of the CCM: CS.sjsu.edu
- ^ http://archive.bridgesmathart.org/2010/bridges2010-247.pdf retrieved August 19, 2018
- ^ Mandelbaum, Ryan F. (2018). "This Trippy Music Video Is Made of 3D Fractals." Retrieved 17 January 2019
- ^ Moeller, Olga de. (2018)."what are Fratals?" Retrieved 17 January 2019.
- ^ "Mandelbrot Set". JoCopeda. Retrieved 15 January 2015.
- ^ Piers Anthony (1992). Fractal Mode. HarperCollins. ISBN 978-0-246-13902-3.
- ^ Arthur C. Clarke (29 September 2011). The Ghost From The Grand Banks. Orion. ISBN 978-0-575-12179-9.
Further reading
[edit]- John W. Milnor, Dynamics in One Complex Variable (Third Edition), Annals of Mathematics Studies 160, (Princeton University Press, 2006), ISBN 0-691-12488-4
(First appeared in 1990 as a Stony Brook IMS Preprint, available as arXiV:math.DS/9201272 ) - Nigel Lesmoir-Gordon, The Colours of Infinity: The Beauty, The Power and the Sense of Fractals, ISBN 1-904555-05-5
(includes a DVD featuring Arthur C. Clarke and David Gilmour) - Heinz-Otto Peitgen, Hartmut Jürgens, Dietmar Saupe, Chaos and Fractals: New Frontiers of Science (Springer, New York, 1992, 2004), ISBN 0-387-20229-3
External links
[edit]- The Mandelbrot Set and Julia Sets by Michael Frame, Benoit Mandelbrot, and Nial Neger
- Video: Mandelbrot fractal zoom to 6.066 e228
- Relatively simple explanation of the mathematical process, by Dr Holly Krieger, MIT
- Mandelbrot set images online rendering
- Various algorithms for calculating the Mandelbrot set (on Rosetta Code)
- Fractal calculator written in Lua by Deyan Dobromiroiv, Sofia, Bulgaria
Category:Fractals Category:Articles containing video clips Category:Articles with example pseudocode Category:Complex dynamics


![{\displaystyle x_{n+1}=rx_{n}(1-x_{n}),\quad r\in [1,4].}](https://wikimedia.org/api/rest_v1/media/math/render/svg/167c3aa4bc1c5840ca0df792debf16643264a7f7)


