User:JaneVannin/translations/topographic
The aim of this tutorial is to show how to create a vector graphics topographic map from DEMs resulting from NASA's Shuttle Radar Topography Mission (SRTM) by using the GIS programs 3DEM andGRASS GIS.
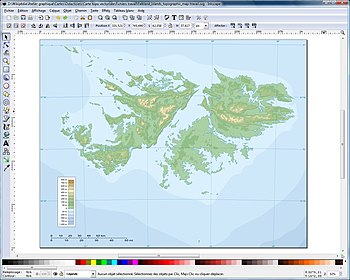
There are several advantages in using DEMs from the SRTM in that the data are free (in the public domain), are freely accessible on NASA's website, are precise (to a resolution of 31 m at the equator), cover practically all inhabited land surfaces (80% of emerged terrain), and come from a reliable source. There is also less chance of making an error in, for example, a contour line trace than from one produced from a scanned map; digitally produced maps are easier to make than hand-drawn ones, and above all for the ends of Wikipedia, the data are instantly accessible to all, saving a huge amount of time in documentary research for freely reusable sources. It is also worth noticing that the maps are in "SVG" format, (except for relief shading images), which can be used at any size without loss of quality.
Those interested in a map produced more simply and in bitmap format can consult the bitmap relief map creation tutorial.
GRASS GIS does not allow the re-projection of a map "on the fly": each map project is precisely defined from its creation (geographical localisation, resolution, projection etc) and may not be modified afterwards. On the other hand it is not possible to import a DEM into a project if the projections are not the same, which obliges us to first create a project using the native projection of the DEM and then a second in the projection which will be used during the final map.
The creation of this type of map is comprised of various stages, but the process is quite simple:
- Fusion of the DEMs and filling in of voids[1] in 3DEM;
- Creation of a project using the native projection of the DEMs and importation of the map into GRASS;
- Creation of a second project using a UTM projection and re-projection of the map;
- Extraction of the altitude segments;
- Vectorisation of each segment of altitude in Inkscape;
- Importation of the coastal map;
- Reframing of the map;
- Colorisation of each level;
- Creation and integration of the map of optimized relief shading;
- Creation and integration of the bathymetry map;
- Finalisation of the map with the latitude and longitude grids and scales.

In addition, this page also shows how to modify the resulting map to produce a thematic topographical map.
The tools
[edit]- 3DEM (version used: 20.3): free and easy to use GIS editor with which the SRTM voids will be filled;
or:
- GRASS GIS official site (version used: winGRASS 6.3.0RC6): free powerful multi platform GIS program used to edit the digital elevation models (DEMs) and extract from them the altitude segments together with the SRTM Water Body Data (SWBD) which are in "shapefile" vector format. These latter contain the corrected trace of the coastlines[2], and the lakes and watercourses of a certain size which will complete the map;
- Remarks:
- This tutorial presents the most rapid method for creating the initial map by using 3DEM which is not designed for other than 32 bit Microsoft Windows platforms. Editors using another operating system can load SRTM files into GRASS GIS and fill the voids using its r.fillnulls module.
- It is possible to use 3DEM to create and directly extract each altitude segment using a UTM projection, but during tests this program was shown to introduce reasonably large errors into altitudes during the re-projection which makes it unsuitable for this task.
Additional tools for the bathymetric map
[edit]- Demis Mapper[3] (download page): free trial version of the program allowing viewing of the Demis world map;
- Demis World Map Data (download page - 502 Mb): world map presenting the same data as Map Clip or their add-on for NASA World Wind with the possibility of choosing visible layers.
Data sources
[edit]For other available resources, consult Wikipedia Map resources
- NASA Shuttle Radar Topography Mission (SRTM) DEMs:
- These are the files released into the public domain, compressed into .zip format, which contain the digital topographic data of the region considered. The zone covered by the DEMs resulting from the SRTM extend from latitude 56° South to latitude 60° North. These files must be decompressed before being used in 3DEM. There are three SRTM file types:
- SRTM1 (download here): the most precise data with a resolution of one arcsecond (31 m at the equator), but which are only available for the United States and its dependencies. Each file represents a rectangle of a degree of an arc to a side referenced according to the coordinates of the bottom left corner.[4].
- SRTM3 (download here): a precision of three arcseconds (93 m at the equator) which covers all emerged land between the latitudes indicated above. Filetypes and references identical to SRTM1. These are the datasets which will be of most use for the needs of Wikipedia.
- SRTM30 (download here): a precision of 30 arcseconds (926 m at the equator), adapted for maps covering more than one country or a continent.
- Each map covers a region of 50° of latitude by 40° of longitude, referenced according to the coordinates of the upper left corner. Each map is contained in a specific folder which contains 12 separate files. Only 10 of these will be of use to us; the remaining files *.jpg.zip and *.gif.zip are just preview files. These 10 files must each be downloaded and decompressed before being used in 3DEM. In the program, select the GTOPO30 Tile option, then in the new window representing the map of the world, centre the frame on the region of interest and specify a Lat/Lon projection. Navigate through the menu and select the .DEM file.
- NASA SRTM Water Body Data (SWBD) (download page) : complementary files to the SRTM containing the precise outline of coasts, lakes and watercourses of a certain size
Creation of the map from the Digital Elevation Models
[edit]Preparation of the map in 3DEM
[edit]- 1. Download the necessary SRTM files, and uncompress them.

- 2. Open 3DEM. Click on File -> Load Terrain Model (1). Select the SRTM Data option (2) and then in the new window all of the < .hgt > files. Confirm with Open.
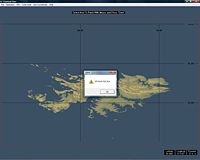
- 3. As the DEM contains pixels without information[1], it is necessary to fill them. GRASS GIS which will be used later can cope with this operation, but it seems to be tricky to handle and takes a lot of time to complete. For reasons of rapidity we will thus carry out this function in 3DEM which produces a rapid and satisfactory result for the needs of Wikipedia, except for cases where the zones without data are very large. Press F7 and select the whole map with the mouse (1). Confirm with the ENTER key. 3DEM fills in these pixels by interpolating the values from adjacent pixels (2). If the map is very large and 3DEM takes too long to carry out these calculations, close the program and start again by selecting a smaller area.
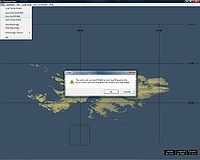
- 4. Export the map in Geotiff format, which is a standard Tiff format but georeferenced: File -> Save GeoTiff DEM. Click on the OK button of the pop up box which appears, and save the file in the root folder for GRASS projects: C:\GRASS\GIS DataBase. This means that you have to import and handle only one map in GRASS, which simplifies the operation.

- 5. Re-project the map as a UTM: Operation -> Change Projection -> Convert to UTM projection. Select the WGS84 option, which is the geodesic system of the SRTM, then click on OK. This operation is only designed to recover the information on the edges of the map in metric UTM format, which are a little tricky to find, not for using the map with this projection, which contains errors in 3DEM as mentioned above.
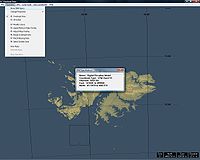
- 6. Check the UTM coordinates of the map which will then be used in the creation of the project in GRASS: Operation -> Show DEM Specs. In the dialogue window which then opens, note the UTM zone of the map ((< 21S > – South – in our example) and the values of the East and North limits.
- A world map of UTM zones is available on Commons;
- You can also convert geographic coordinates to UTM by using an online tool such as that offered by Digital Mapping Solutions ;
- Our example (the Falkland Islands) is special because the map is on the cusp of the 20 and 21 South UTM zones. 3DEM in this precise case permits the re-projection as a UTM even though in general that would not be the case when the map covers several zones. Here this facilitates enormously the determination of the map limits which will be necessary during the creation of the project as a UTM in GRASS.
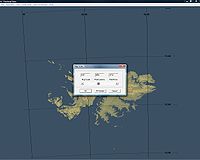
- 7. Press F6 and move the cursor so that the map size in pixels is the same as that of the final map. Confirm with OK.

- 8. Save a preview of this map which will act as a reference to trace the coordinate grid: File -> Save Map Image and select jpeg format. Once this is done, you can close 3DEM.

- 9. If your map covers more than one UTM zone and 3DEM cannot re-project it as a UTM, reopen your map and, only selecting the DEM of the central zone or which contains the most data, proceed with the re-projection. Check the UTM coordinates of this portion of the map, note them, then close 3DEM.
- Important note regarding UTM coordinates: UTM coordinates are not linear from one zone to another: the coordinates of the eastern limit of one zone do not correspond to those of the western limit of the next zone to the right because the point of reference of each map is unique to itself (for more detail, see Universal Transverse Mercator). If the map covers several UTM zones one cannot therefore directly use the Digital Mapping Solutions coordinate transformation tool as it will give a result only for the zone in which the considered point is to be found.
- A very simple and rapid method for working out approximately the coordinates of the whole map consists of adding (if it overlaps the main zone to the east) to the largest value or subtracting (if the overlap of the main zone is to the west) to the smallest value the length on the ground of a degree of an arc at the Equator, for each degree (and thus each SRTM file) which overlaps.
- Knowing that a nautical mile which has a length of 1,852 m effectively corresponds to the length of an arc minute at the Equator, a degree of this grand circle will have a length near to 1,852 x 60 = 111,120 m. It is this value that we will add or subtract to the coordinates of the part of the map covering more than one UTM zone for each degree which overlaps.
- Example: Let us suppose that we have a map extending from 17°E to 26°E (regardless of latitude), thus 1° in the 33 zone, 6° in the 34 zone (all of its width) and 2° in the 35 zone.
- By only selecting in 3DEM the SRTM of zone 34 (which is our main zone) and by re-projecting this part of the map as a UTM, we can see in Operation -> Show DEM Specs the coordinates East: < 240120 > and< 759690 >.
- The map completely overlapping by a degree to the West, we can subtract 111,120 m from 240120, which gives 129000. To the East, the map overlaps by two degrees, so we add 2 x 111,120 m =222,240 m to 759690 which gives 981930. These are the two values which will be specified for the westerly and easterly limits during the creation of the project of this map as a UTM in GRASS.
- The zone for the map in GRASS will certainly be too wide because the more one increases in latitude, the shorter is the length on the ground of a degree of an arc, but this is not important.
Creation of the Lat/Lon project for the map in GRASS GIS
[edit]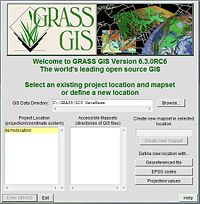
- 10. Start GRASS GIS in Old TclTk GUI and click on the Projection values button to create a new project in the native projection of the map (Lat/Lon).

- 11. In the new DOS window, enter a name (without accents or special characters) for your project (=map) in the LOCATION: field (in our example, the Falkland Islands). The MAPSET: will be PERMANENT and the DATABASE: the root file containing all of the projects (C:\GRASS\GIS DataBase by default for GRASS version 6.3RC6). Press the ENTER button, then ESC and ENTER again to continue.

- 12. Confirm the creation of the project (location) with ENTER.

- 13. Various data will be necessary for GRASS to parameter your project (cartographic projection, geographical limits of the map, etc). Collect or check this information then press ENTER.

- 14. Projection of the map. For a map resulting from the SRTM as in our example, it is Latitude-Longitude which is their native projection. If you use these DEMs, press B then ENTER and confirm again with ENTER.

- 15. Give a short description of the subject of your map then press ENTER and confirm again with ENTER.

- 16. GRASS will ask if you would like to specify a geodesic system for your project. If you use the DEMs from the SRTM, press ENTER, enter wgs84 and press ENTER again.
- NOTE: you can also see a list of all available systems by entering list and then pressing the ENTER key.

- 17. GRASS asks you to select the transformation parameters for the geodesic system. Enter list and press ENTER. For WGS84, the only option available is < 1 >. Enter this figure and press ENTER.

- 18. Enter the values in degrees of the North, South, East and West limits of the zone covered by your map. Press ENTER to change field.
- Opposite, the fields filled in for the example of the Falkland Islands which extend from 53°S to 50°S and from 062°W to 057°W.
- 19. GRID RESOLUTION: the two fields represent the desired resolution in pixels for the map. In the case of SRTM3, the native resolution is 3 arc seconds (1 arc second for the SRTM1 data covering the United States). These values can be entered in decimal form (0.00XX) or sexagesimal (0:00:XX) which is the most practical in our case. For a map using the DEMS of SRTM3 at their native resolution, enter the value 00:00:03 (corresponding to 0 deg. 0 min. 03 sec.) for each field. Confirm all of the values with ESC then ENTER. GRASS reconfirms the values you have entered. If you are happy with these, press ENTER.
- In the example on the right below one can check that the native resolution of the SRTM3 DEMs has been specified: the map extending over 5° of width and 3° of height, its size in pixels is, as it should be, 5 x 1,200 by 3 x 1,200 (1,200px x 1,200px being the native size of an SRTM3[5]
 |
 |
| Entering the resolution | Confirmation of the information |

- 20. GRASS confirms that it has created LOCATION (Falkland_Islands in our example). Press ENTER, which will take you back to the initial state of the DOS window. Press ESC then ENTER to confirm all and close this DOS window.

- 21. You will now see again the graphic interface window with, in the field Project Location the folder you have just created (Falkland_Islands in our example). By clicking on this name, you will see in the Accessible Mapsets field the subfolder PERMANENT which has been created. Select it. The grey button Enter GRASS on the left at the bottom of the window will then become green and active. Click on it to enter GRASS.
Importing the map into GRASS GIS
[edit]
- 22. Import the GeoTiff map in GRASS format: select File -> Import raster map -> Multiple formats using GDAL. A window r.in.gdal specific to the module opens.

- 23. Select the Required tab(1). Click on the folder button (2) and navigate through the menu to select the GeoTiff map created in 3DEM which can be found in the C:\GRASS\GIS DataBase folder. Enter a name for the map in the field Name for output raster map (3).

- 24. Click on the Run button to start the import which is detailed in the Output - GIS.m window. When the import process is finished, close the module window and exit GRASS.
Creation of the UTM project for the map in GRASS GIS
[edit]
- 25. Open GRASS again and click on the Projection values button to create a new project using a UTM projection.

- 26. Enter a specific name for the project (LOCATION). The most practical is to reuse the name of the Lat/Lon project created previously and to add _UTM at the end. Press ENTER then ESC and again ENTER.

- 27. Confirm the creation of the project with ENTER.

- 28. Continue by pressing ENTER.

- 29. For the projection, press C (UTM) then ENTER twice.

- 30. Give a short description of the project and press ENTER three times.

- 31. For the geodesic system, enter wgs84 once again and then press ENTER.

- 32. For the transformation parameters, press 1 and press ENTER.

- 33. Select the hemisphere in which the map is situated by typing y or n and then ENTER.

- 34. Enter the number of the UTM zone of the map and then press ENTER.

- 35. Enter the metric UTM coordinates of the map indicated by 3DEM in step <6;> or calculated in step <9> if the map covers more than one UTM zone. Press ENTER to change field.

- 36. GRID RESOLUTION: enter the resolution in metres by pixel required for the map. For a native SRTM3 resolution, enter 93. Enter 186 for a resolution and thus a map twice as small. Confirm your choices with ENTER then ESC and again with ENTER.

- 37. On the following page, check the confirmation of the data, in particular the size in pixels (number of rows and cols) of the map, then enter y and ENTER to confirm the choices.

- 38. The project (LOCATION) has now been created. Press ENTER to return to the initial DOS screen then ESC and ENTER again to close this window.

- 39. You will see the startup window of GRASS again with, in the field Project Location, the name of the folder which has just been created (Falkland_Islands_UTM in our example). Click on this then on PERMANENT in the field Accessible Mapsets and finally on the Enter GRASS button to enter the program.
Re-projection of the map
[edit]
- 40. In the GIS manager window of GRASS, go into Raster -> Develop map -> Re-project. In the new window of the r.proj module, enter into the Name of input raster map to re-project field, the name of the map previously treated in step < 23 >. In Location of input raster map:, enter the name of the project using the projection Lat/Lon which is the place where the source map is to be found. In Name for output raster map, enter the name of the map, adding _UTM to differentiate it from the first. When the process is finished (indicated by « r.proj complete » in the Output - GIS.m window) close the r.proj module window.

- 41. In the main window, create a bitmap layer (click the button Add raster layer) then click on the button to the right of Base map: and select the map which has just been re-projected.

- 42. In the Map Display 1 window, click on the first button, Display active layers to preview the map.

- 43. You can change the default colours by going in the main window into the menu Raster -> Manage map colors -> Color tables which opens the r.colors module window. Go into the Required tab, and click on the coloured button then select your map.

- 44. On the Colors tab, select, for example, < srtm > from the Type of color table: drop down menu. Click on the Run button then close this module window.

- 45. To view these modifications, click on the second button, Redraw all layers in the Map Display 1 window.

- 46. Add a linear scale by clicking on the Scalebar and north arrow button in the main window: this permits the creation of the scale in the final map. Refresh the map. Save a preview of this map with the scale (the scale is not integrated into the map when exported with the r.out.png module) by clicking in the Map Display 1 window on the button representing a diskette, then on JPG -> very high resolution. Save the image, for example, under the name View_topo_GRASS_scale (saved by default in the C:\GRASS folder).
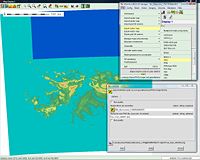
- 47. Export the bitmap map: go into File -> Export raster map -> PNG. In the exportation module window, click on the button in the field Raster file to be converted: and select your map. In the field Name for new PNG file, replace <rasterfilename> with < View_topo_GRASS > then click Run. Your image will be stored by default in the root folder of the program: C:\GRASS. Keep the module open.
Extraction of the altitude segments
[edit]This section explains how to extract the altitude segments which will be vectorised in Inkscape in order to create a vectorial topographic map. If you want to create a map with the same appearance but as a bitmap, consult the last part of this section.

- 1. Determination of the number of contour lines which will be represented on the map. For this, you will need the altitude information from the DEM: in the main window, click on the button with a large blue < i > to the right of the name of the map. In the < Output - GIS.m > window, various information appears regarding the DEM, in particular its maximum and minimum altitudes. In our example of an island, only the maximum altitude is relevant (here: 701 m)[6].
- Choose, if possible, an interval with a round figure (50, 100, 200 or 250 m, etc). In our example with a relief composed of hills, an interval of 100 m is the most suitable, necessitating eight altitude segments (0 to 100 m ; 100 to 200 m ; … ; 700 to 800 m)[7], a reasonable value to clearly represent relief: too few segments will not permit for correct visualisation of the structure of the relief whilst a number higher than 11 will probably make difficult their visual separation on the final map.
- For a map showing a coastline, the first altitude segment is the most important because it permits the ready differentiation of the coastal plains from the first hills. This value is generally around 50 m, or 100 m if the terrain is particularly accidented. In the example opposite, we will choose 50 m, the following segments being at 100m, 200m, 300m, etc, which will give us in total nine segments (colours).

- 2. Open Windows Explorer, go into the folder C:\GRASS\etc\colors, select the file srtm and edit it with a text editor, for example OpenOffice.org Writer (avoid Windows Notepad which does not handle UTF-8 well). Immediately save this file in .txt format under another name, for example < Black&White > to avoid modifying the original file by mistake.

- 2. Delete the existing text and paste in the following.
-500 white
50 white
50 black
10000 black
- Save. This file is a table of colours which can be used for a map. As it is here presented, the table specifies that for the altitudes from -500 m to +50 m the map will be white and from 50 m to 10 000 m black. The line < 50 white > produces a distinct colour transition. If this line was not present, the transition would be made with a gradient of grey like that which may be observed by previewing a map using the srtm colour table. The value < 50 > indicates that this table will be used to extract the altitude segment from 50 m. Keep the file open.

- 3. Modify the colorimetric table applied to the map: open once again the module r.colors (Raster -> Manage map colors -> Color tables). On the Required tab, select your map and on the Colors tab, the table < Black&White.txt > which you have just created. Click on Run to launch the operation. In the Map Display 1 window, click on the Redraw all layers button to refresh the display.

- 4. Export (File -> Export raster map -> PNG) this altitude segment: specify as PNG the filename < 50_m > then click on Run.

- 5. Activate the text file < Black&White > again and replace the two < 50 > values with < 100 > to extract this altitude segment. Save the changes.

- 6. Click on the Run button again in the r.colors module to apply these modifications, then refresh the view of the map. Export it with the name < 100_m .png >.
- 7. Repeat these operations for the remaining altitude segments. Close GRASS.

Note for the creation of a topographic bitmap map:

Instead of extracting each altitude segment, if we specify for each of them the colours of the French Wikipedia topographic map colour convention we get a map with the same appearance as the final version with clearly distinct colours but in bitmap format which can then be exported as a whole. To do this, edit the srtm colour table contained in the C:\GRASS\etc\colors folder as described above, and replace the original contents with the following text (example for the Falkland Islands - you can adapt the altimetric values and the colours to your own map):
-500 172 208 165
0 172 208 165
0.1 172 208 165
50 172 208 165
50 148 191 139
100 148 191 139
100 168 198 143
200 168 198 143
200 189 204 150
300 189 204 150
300 209 215 171
400 209 215 171
400 239 235 192
500 239 235 192
500 222 214 163
600 222 214 163
600 202 185 130
700 202 185 130
700 192 154 83
Save the file in .txt format under a specific name. Apply this new colour table to your map and export it in png format. The colour of the sea is here the same as that of the first altitude segment to correct the imprecisions of the line of the coast of the SRTM[2]. The definitive coastline will be realised from the SWBD.
Creation of the SWBD map
[edit]Aquatic surface vector mapping tutorial
Vectorisation of the altitude levels
[edit]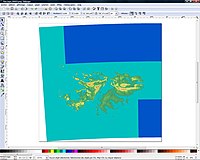
- 1. In Inkscape, open (CTRL + O) the View_topo_GRASS.png map: the document automatically adapts itself to the size of the map.

- 2. Create new layers, one for each altitude segment, not forgetting the < Coast > layer, which will contain the map of emerged terrain (the coastline) resulting from the SWBD. Move the GRASS map to its layer. At the top of the pile, create a layer < Legend >.
- 3. Import the image View_topo_GRASS_scale.jpg (the one with the scale) into the same layer as the map from GRASS. Resize the preview to make it coincide with the main map then move it beneath the latter.

- 4. Draw in the < Legend > layer an empty rectangle with a black border of around 2 pixels in line with the frame of the final map: this will allow both visualisation of the limits of the map and also the reframing of the DEMs. Lock this layer and « hide » the layer View topo GRASS.

- 5. Activate the 50 m layer and import (CTRL + I) the map 50_m.png. Align it on the page (X = 0 - Y = 0).
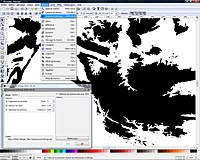
- 6. Zoom to 140 % and go into Path -> Trace bitmap In the new window, select Brightness cutoff (the value of the cutoff is not important). On the Options tab, for the value of Suppress speckles, indicate a size of < 5 >[8]; for Smooth corners, specify the maximal value of < 1,34 >; for Optimise paths, a tolerance of < 5,00 >.
- 7. Click on OK to begin vectorisation of the image.

- 8. Open Fill and Stroke (SHIFT + CTRL + F) and delete the fill. On the "Fill" tab', click on the "Flat color" icon and specify a value for the red of < 255 > for example in order to obtain a good contrast in comparison to the black and white image.

- 9. Open the Inkscape Preferences menu (SHIFT +CTRL + P). On the "Misc" tab, specify a simplification threshold of < 0,0001 >[9]. Close this window.
- 10. Look at the bottom of the window to see the number of nodes that the path contains and carry out an initial simplification by pressing < CTRL + L >. Check the path: if the line becomes distorted and takes on an unnatural appearance, it is because the threshold of simplification is too large. In this case, cancel the simplification, reduce the simplification threshold in Inkscape's preferences, select the path again and carry out the simplification again. Press < CTRL + L > again and check the line of the path: continue with the simplification if the contour remains valid and cancel the simplification if not. An optimal simplification permits a significant reduction in the number of nodes to the point of producing a file small enough for the Internet whilst at the same time preserving a path that follows most faithfully the original course of the coast. When a satisfactory result is achieved, select the bitmap image and delete it. Save the SVG file with a working name.
- Scale of a map and simplification of the paths: The native resolution of an SRTM3 is 93 m per pixel at the equator. By taking as a standard of precision 0,25 mm when the map is printed, the native scale of this type of DEM is 1:372 000e (see the tutorial Calculation of the scale of a map). If during the simplification of the paths these do not become distanced from the original trace by more than a pixel, the spatial precision will then be to two pixels (+/- 1 pixel), or 186 m which equates to a scale of 1:744 000e. It is thus necessary to adapt the threshold of simplification of the paths as a function of the precision required for the map.
 |
 |
| Simplification threshold too high producing a distorted outline | Acceptable simplification with a valid outline |

- 11. Activate the < 100 m > layer, import (CTRL + I) the bitmap image < 100_m.png > and align it on the document (X = 0 ; Y = 0). Proceed in the same manner to vectorise this image.

- 12. Carry out the vectorisation of the other levels, not forgetting to align the images in the document first because there is no way of aligning just the path later. Save the document.

- 13. Remark relating to the < 700 m > level for the example opposite: GRASS having found in the DEM a maximal altitude of 701 m, this level contains very little information. With the threshold of parasite suppression during vectorisation set to < 5 >, the operation will not capture any path. To avoid this, set this parameter to < 0 > before carrying out the vectorisation.
Integration of the SWBD map
[edit]
- 1. Activate the < 700 m > layer and create a < Lakes > layer above it. « Hide » all of the layers except < View topo GRASS >, < Coast > and < Legend >.

- 2. Activate the < Coast > layer and import the SWBD map created using the Aquatic surface vector mapping tutorial.
This layer usually contains a group of two paths, one for the coastline and one for the lakes and large rivers. Align it perfectly above the preview of 3DEM. Increase the zoom to 300 % to verify this as this stage is extremely important to avoid any discrepancy between the SWBD map and the different relief levels which might cause, for example, a lake to appear to be on the slope of a hill. Save.
- 3. Ungroup (CTRL + SHIFT + G) the two paths of the SWBD map (coastline/lakes and rivers). Select only that for the lakes and rivers and move it to the < Lakes > layer.
Creation of the map with relief shading
[edit]Reframing the map
[edit]Attention - Before turning and reframing the map, it may be useful to import the bathymetry and the different paths (rivers, frontiers etc) if they were created and re-projected with GRASS. The images are easier to import and align before the rotation and reframing process!

- 1. Create a < Shading > layer between the two layers < 700 m > and < Lakes > and import into it the optimized image of the shading. Align it in the page then « hide » this layer.

- 2. Create a < Preview 3DEM > layer above the < Lakes > layer and import into it this image (the one with the UTM projection and the coordinate grid). Align it on the page and check that it is correctly positioned with regard to the GRASS map by making it partly transparent. Return the opacity to < 100% >.

- 3. Unlock the < Legend > layer. Select the SHIFT + F6 tool and draw a horizontal and/or vertical line by keeping the CTRL key down so that the line is close to one of the coordinate lines. This or these line(s) will act as a reference during the rotation of the layers to make the map aligned (so that North is vertical at the centre of the map). Lock the layer again.

- 4. Check that all of the layers are visible and unlocked. With the F1 tool activated, select all of the objects contained within the map (CTRL + ALT + A). Click on the map to go into Rotation mode.

- 5. Click on one of the arrows in a corner and turn the map: the coordinate line and the straight line previously drawn should merge at the edge of the frame contained in the < Legend > layer (which stays still because it is locked) which marks the edges of the final map.
- 6. When the result is satisfactory, activate the < Legend > layer, unlock it and delete the straight line which it contains. Modify the position and/or the dimensions of the frame if necessary to centre it on the subject. Lock the < Preview 3DEM > layer and make it invisible.

- 7. Make the < Lakes > layer invisible: all that remains visible are the image of the shading and the black frame. Select the frame and call up the document properties window. Click on the Fit page to the selection button to resize the page to the size of the frame. Close the dialogue window and make the < Legend > layer invisible.

- 8. Export the reframed image of the shading: press CTRL + SHIFT + E, check that the Page option is selected, enter a name for the image (for example Shading_crop.png and launch the exportation.

- 9. Close all the layers except for < Coast > layer and fill it with black. Delete its contour. Export this map, which represents emerged land surfaces, in PNG format, for example as < Coast_black.png > and which will be used to delimit the shaded relief. After the exportation, close the dialogue window then delete the fill of the path and apply a contour.
- 10. If the altitude segment which covers the DEMs overlaps the frame of the map which you have fixed (as is generally the case for a continental map), delete the nodes outside this frame which will otherwise unnecessarily increase the size of the final file. Carry out this operation for each segment of altitude, and also for the two paths resulting from the SWBD (the < Coasts > et< Lakes > layers).
 |
 |
| The path after vectorisation | Deletion of surplus nodes |
Colorisation of the map
[edit]
- 1. Fill the path of the < Coast > layer with the first green of the French Wikipedia topographic map colour convention (#ACD0A5). Check that the contour is in fact blue #0978AB and adapt its thickness as a function of the map.

- 2. « Show » the < 50 m > layer, select the path and fill it with green according to the colour convention (#94BF8B). Delete its contour which will otherwise visually overload the map. Proceed in the same fashion for the other levels.
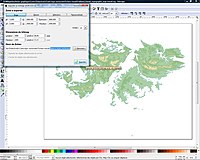
- 3. Export a preview of the vectorised and coloured topographic map (Page option) which will be used to visualise the effect produced by the shaded relief map.
Integration of the relief shading
[edit]Preparation of the map
[edit]- '1. In GIMP open the preview of the vectorised map which has just been created. Open the optimized and reframed shaded relief map (Shading_crop.png) then Coast_black.png as a layer (CTRL + ALT + O).

- 2. Activate the shading layer (1) and select the pipette tool (2). Click on the sea, a lake or a flat zone (3) representing a plain (hide the Coast_black.png layer if necessary) to sample this grey value for the foreground colour.

- 3. With the Coast_black.png layer active (1), choose the "Select regions by color" tool (2). Untick the "Feather edges" option and set the threshold at < 0 >. Select the transparent zone corresponding to the sea.

- 4. « Hide » the Coast_black.png layer, activate the shadow layer and choose Edit -> Clear: this operation removes all relief features except those of emerged land because the shading, as with other data from the SRTM DEMs is affected by imprecisions along coastlines. Deselect.
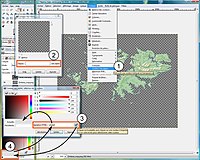
- 5. Go into Colors -> Color to Alpha... [10] (1). Click on the white rectangle (2). In the new window, click on the button to the right of the HTML Notation field (3) then on the zone representing the foreground colour previously defined (4). Confirm the selection of this grey colour then confirm again to send this colour to an alpha channel: all the flat zones of the shadow layer, without relief, become transparent.

- 6. Once again select the Color to Alpha… tool (1) and this time specify the colour white (2). Confirm: the whites (ie illuminated zones) become transparent and all that remains is the shading which is applied as a "Multiply" fusion. Proceed in this order: grey then white to alpha channel, which gives the best results.

- 7. The shading being too pronounced and Inkscape not handling the transparency of bitmap images included in a SVG file, it is necessary to prepare the shading layer before integrating it into the topographic map. Modify the transparency of the layer to < 30 % > so that the shading is both sufficiently visible and emphasizes the relief forms, whilst at the same time it does not interfere with the interpretation of different altitude segments.

- 8. When the result is satisfactory, « Hide » the layer of the topographic map resulting from Inkscape then go into Image -> Mode -> Grayscale: the removal of colour information will save kilobytes in the final map. Save the shading in PNG format (to retain the transparency), for example under the name of Shaded_relief_image.png. Quit GIMP.
Integration of the shading into the SVG file
[edit]
- 9. Start Inkscape again. Make the < Shading > layer visible, select the image which it contains and delete it. Import the semi-transparent Shaded_relief_image.png image, which has just been created and align it in the document.

- 10. Incorporate this bitmap image into the document, which will permit it to be displayed correctly in Wikipedia: go into Effects -> Images -> Embed all images'. In the new window, tick the Embed only the selected images' option (in order to avoid incorporating the previews of GRASS and 3DEM which are currently hidden), then confirm. Save.
Creation of the bathymetric map
[edit]For the detailed article, see the Topographic map bathymetry tutorial
Completion of the map
[edit]
- 1. If the bathymetry has been created in a separate document, activate the < Coast > layer and create new layers, one for each segment of depth, to place above each other (the deepest segment on top of the pile). Import the bathymetric map created with the tutorial above, align it on the page, degroup the paths and move each segment within its layer.

- 2. Make the < Legend > layer visible in order to see the frame that it contains. Make the < Preview 3DEM > layer visible, then create a new layer < Coordinates > above. With the straight line tool (SHIFT + F6), draw using two points the segments above the grid of the preview of 3DEM. For the curved latitude lines, activate the F2 tool, select the two nodes of the segment and add a new node in the middle (1). Select only this last node, and then click on the Make selected nodes symmetric button (2) and move it upwards or downwards to superimpose it on the grid of the map from 3DEM (3). Add the numerical values of the coordinates at the borders of the map.

- 3. Create a distance scale: make the < View topo GRASS > layer visible and move it just below the < Legend > layer. Select the main displayed map and move it to the bottom of the pile to see the preview View_topo_GRASS_scale.jpg (with the kilometric scale) which was placed below. Activate the < Legend > layer and draw straight lines (SHIFT + F6) to copy this scale. Also add an equivalence in miles to facilitate international use. Combine (CTRL + K) all of the segments to transform the scale into a single path. Add the numerical values corresponding to each index.
- To produce a scale in miles reasonably easily, move the kilometric scale so that it is aligned with the edge of the page (X = 0). With the F1 tool, select, for example, the 100 km point and from the Position X field, read the value of its position in pixels.
- Knowing that 1 mile = 1,609 km (approximate value), if the 100 km point is placed at 200px, you can say that you need to position the 100 mile point at 200 x 1,609 = 321,8px.

- 4. Finally, create an altimetric scale by filling in the different boxes with the colours used in your map. Save. Remember to delete the < View topo GRASS > and < Preview 3DEM > layers before importing the map into Wikipedia.
The map is now ready to receive additional data (rivers, frontiers, towns, roads, geodesic points etc). For these operations, see the relevant tutorial.
Thematic topographic maps
[edit]Another use for the topographic vector graphics map which has just been created, and which requires very little modification to produce, is a "thematic topographic map".
In cases where the topography is not the main subject but where the determination of the levels of altitude is essential, a map showing altitude levels with a colour code is unuseable because any further coloured layer representing the thematic zone, even one which is partially transparent, would render the map unreadable. To produce this type of map, we will employ the flexibility of the SVG format and keep only the contour lines, reserving colours for the thematic zones.
The domains which may require thematic topographic maps are diverse: climatology, geology, hydrography, vegetation distribution, human geography, etc.
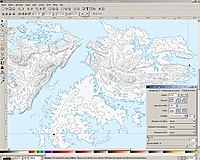
- 1. Open the topographic vector graphics map in Inkscape. Select the path of the < Coast > layer, and fill it with white. For each of the other levels, delete the fill colour and choose a black contour. The contours having by default a thickness of one pixel, reduce this value to around < 0,500 > depending on your map in order that the paths are visible but do not take over the map.

- 2. « Hide » all of the altitude level layers except for that of the emerged terrain. Create above this a < Thematic > layer. Duplicate the path of the coast and place it in this layer. Delete its fill colour.
- 3. Import the thematic bitmap map which you are going to use as a reference. Reduce its opacity and resize it to position it correctly above the path of emerged terrain.
- 4. Draw the paths delimiting the thematic zones. For those adjacent to the coastline, duplicate the path < Coast >, combine it with that of the zone, then delete the unused coastline nodes.
For the detailed article, see the map coloration by zones tutorial
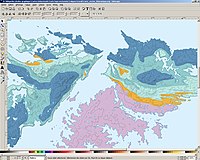
- 5. Finish the map by deleting the contours and by filling the thematic zones with colour. If required, add along each contour line the corresponding altitude value.
Notes
[edit]- ^ a b One of the problems with SRTM files is that, in spite of the fact that practically all emerged terrain has been overflown at least twice, certain zones have remained hidden from the oblique radar ray due to the sharply accidented relief, giving rise to voids in the map information.
- ^ a b A defect of SRTM files is their lack of precision in coastal areas, particularly as a result of wave action which can produce a false radar reading. The SRTM Water Body Data (SWBD) files provided by NASA are intended to resolve this problem.
- ^ Demis Mapper only works on Windows 95 or higher (Windows NT 4.0 or higher recommended).
- ^ Example: the file N48E001.hgt.zip, (decompressed: N48E001.hgt), covers the zone between the 48° and 49° North and 001° and 002° East.
- ^ In reality 1,201px x 1,201px, but the reference of SRTMs being placed at the centre of each pixel, a half-pixel each side is lost.
- ^ The DEMs are not exact to the nearest metre. Therefore the highest value found may differ from that which you may already know from topographic reference maps. In the example shown by the screen capture, GRASS has found in the DEM a maximum altitude of 701 m. In reality, the highest summit of the Falkland Islands is Mount Usborne at 705 m.
- ^ This example is a special case with its maximum altitude established at 701 m in the DEM, a level which will carry very little information.
- ^ Variable figure depending on your map.
- ^ Variable figure depending on the number of nodes on the path. Try different values to see which is the most suitable.
- ^ For older versions of GIMP, go into Filters -> Colors -> Color to Alpha....
Sources
[edit]| This page contains a translation of Wikipédia:Atelier graphique/Didacticiels cartographiques/Didacticiel_de_création_de_carte_topographique_vectorielle from fr.wikipedia. |
Links
[edit]
The table above has links to various tutorials and resources which can help in the creation of Wikipedia maps from digital georeferenced data (GIS).


