From Wikipedia, the free encyclopedia
this is where im gonna put my assorted wikiboxes
1996 United States House of Representatives elections Turnout 69.3%[ 1] pp )
Majority party
Minority party
Leader
Ted Kennedy
Gerald Ford
Party
Democratic
Liberal Republican
Leader since
April 6, 1968
February 22, 1976
Leader's seat
Massachusetts 9th Michigan 5th
Last election
114 seats, 40.11%
136 seats, 35.89%
Seats before
114
136
Seats won
147
103
Seat change
Popular vote
4,855,425
3,552,994
Percentage
44.34%
32.45%
Swing
pp
pp
Third party
Fourth party
Pro.
Leader
Edmund Muskie
Benjamin C. Bubar
Party
American Labor
Prohibition
Leader since
July 7, 1975
March 30, 1979
Leader's seat
Maine 1st Maine 1st (lost re-election)
Last election
26 seats, 17.88%
6 seats, 4.61%
Seats before
27
5
Seats won
32
0
Seat change
Popular vote
2,165,087
185,486
Percentage
19.77%
1.70%
Swing
pp
pp
1988 United States general election
Majority party
Minority party
Third party
Leader
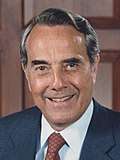
Bob Dole
Jerry Brown
Edmund Muskie
Party
Liberal Republican
Democratic
American Labor
Leader since
June 11, 1983
June 16, 1984
July 7, 1975
Leader's seat
Kansas 1st California 3rd Maine 1st
Last election
211 seats, 50.03%
40 seats, 28.02%
30 seats, 18.81%
Seats before
203
38
32
Seats won
169[ b]
83
43
Seat change
Popular vote
5,667,543
4,205,072
2,685,263
Percentage
43.02%
31.92%
20.38%
Swing
pp
pp
pp
1993 United States House of Representatives elections
Majority party
Minority party
Third party
Leader
Bill Clinton
Trent Lott
Ross Perot
Party
Democratic
Southern Heritage
Reform
Leader since
June 9, 1992
July 25, 1990
December 1, 1991
Leader's seat
Arkansas 4th Mississippi 5th Texas 33rd
Last election
83 seats, 31.92%
pre-creation
0 seats, 2.09%
Seats before
81
10
1
Seats won
177
54
52
Seat change
Popular vote
5,647,952
1,846,024
2,559,245
Percentage
41.24%
13.52%[ ii]
18.69%[ i]
Swing
pp
pre-creation
pp
Fourth party
Fifth party
Leader
Jesse Jackson
Dan Quayle
Party
American Labor
Liberal Republican
Leader since
December 5, 1989
June 13, 1993
Leader's seat
District of Columbia at-large Indiana 4th (lost re-election)
Last election
43 seats, 20.38%
169 seats, 43.02%
Seats before
44
156
Seats won
9
2
Seat change
Popular vote
939,575
2,186,422
Percentage
6.88%
16.04%
Swing
pp
pp
1996 United States House of Representatives elections
Majority party
Minority party
Third party
Leader
Bill Clinton
Ross Perot
Newt Gingrich
Party
Democratic
Reform
Southern Heritage
Leader since
June 9, 1992
November 1, 1991
March 15, 1997
Leader's seat
Arkansas 4th Texas 33rd Georgia 6th
Last election
177 seats, 41.24%
52 seats, 18.69%
54 seats, 13.52%
Seats before
174
50
50
Seats won
155
60
44
Seat change
Popular vote
4,994,277
2,513,080
1,385,821
Percentage
38.46%
19.35%
10.67%[ iii]
Swing
pp
pp
pp
Fourth party
Fifth party
Leader
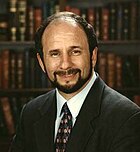
Paul Wellstone
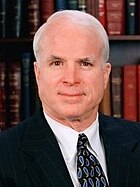
John McCain
Party
American Labor
Liberal Republican
Leader since
October 14, 1995
April 29, 1995
Leader's seat
Minnesota 8th Arizona 1st
Last election
9 seats, 6.88%
2 seats, 16.04%
Seats before
9
2
Seats won
21
20
Seat change
Popular vote
1,434,509
2,446,705
Percentage
11.05%
18.84%
Swing
pp
pp
1996 United States House of Representatives elections
Majority party
Minority party
Third party
Leader
Bill Clinton
Gary Bauer
Newt Gingrich
Party
Democratic
National
Southern Heritage
Leader since
June 9, 1992
November 1, 1991
March 15, 1997
Leader's seat
Arkansas 4th Kentucky 4th Georgia 6th
Last election
155 seats, 38.46%
60 seats, 19.35%
44 seats, 10.67%
Seats before
161
58
44
Seats won
172
66
38
Seat change
Popular vote
5,252,031
3,276,929
1,377,727
Percentage
40.85%
25.49%
10.72%[ iv]
Swing
pp
pp
pp
Fourth party
Fifth party
Leader
Paul Wellstone
Gerald Ford
Party
American Labor
Liberal Republican
Leader since
October 14, 1995
April 29, 1995
Leader's seat
Minnesota 8th Michigan 5th
Last election
21 seats, 11.05%
20 seats, 18.84%
Seats before
19
15
Seats won
13
12
Seat change
Popular vote
1,093,868
1,566,998
Percentage
8.51%
12.19%
Swing
pp
pp
1996 United States House of Representatives elections
Majority party
Minority party
Third party
Leader
Bob Graham
John Kasich
Newt Gingrich
Party
Democratic
Republican
Southern Heritage
Leader since
November 14, 2003
March 20, 2004
March 15, 1997
Leader's seat
Florida 15th Ohio 15th Georgia 6th
Last election
172 seats, 40.85%
78 seats, 37.68%1
38 seats, 10.72%
Seats before
168
72
33
Seats won
135
99
54
Seat change
Popular vote
4,982,220
4,019,498
1,680,109
Percentage
36.73%
29.63%
12.39%[ v]
Swing
pp
pp
pp
Fifth party
Leader
Howard Dean
Party
American Labor
Leader since
January 24, 2003
Leader's seat
Vermont 5th
Last election
13 seats, 8.51%
Seats before
14
Seats won
19
Seat change
Popular vote
2,127,403
Percentage
15.68%
1996 United States House of Representatives elections
Majority party
Minority party
Third party
Leader
John Kasich
Bob Graham
Newt Gingrich
Party
Republican
Democratic
Southern Heritage
Leader since
March 20, 2004
November 14, 2003
March 15, 1997
Leader's seat
Ohio 15th Florida 15th Georgia 6th
Last election
99 seats, 29.63%
135 seats, 36.73%
54 seats, 12.39%
Seats before
98
133
53
Seats won
124
103
51
Seat change
Popular vote
5,374,071
4,479,415
1,553,201
Percentage
36.27%
30.23%
10.48%[ vi]
Swing
pp
pp
pp
Fourth party
Leader
Howard Dean
Party
American Labor
Leader since
January 24, 2003
Leader's seat
Vermont 5th
Last election
19 seats, 15.68%
Seats before
18
Seats won
29
Seat change
Popular vote
2,589,597
Percentage
15.68%
Swing
pp
1996 United States House of Representatives elections
Majority party
Minority party
Third party
Leader
John Kasich
Warren Christopher
Newt Gingrich
Party
Republican
Democratic
Southern Heritage
Leader since
March 20, 2004
November 14, 2003
March 15, 1997
Leader's seat
Ohio 15th North Dakota 3rd Georgia 6th
Last election
124 seats, 36.27%
103 seats, 30.23%
51 seats, 10.48%
Seats before
127
95
48
Seats won
143
77
49
Seat change
Popular vote
5,209,069
3,633,185
1,379,991
Percentage
37.65%
26.26%
9.98%[ vii]
Swing
pp
pp
pp
Fourth party
Fifth party
Leader
Howard Dean
Jesse Ventura
Party
American Labor
Green
Leader since
January 24, 2003
August 27, 2006
Leader's seat
Vermont 5th Minnesota 3rd
Last election
29 seats, 17.48%
0 seats, 4.48%
Seats before
30
1
Seats won
37
0
Seat change
Popular vote
2,515,288
937,613
Percentage
15.68%
6.78%
Swing
pp
pp
1996 United States House of Representatives elections
Majority party
Minority party
Third party
Leader
John Kasich
Howard Dean
Lincoln Chafee
Party
Republican
American Labor
Democratic
Leader since
March 20, 2004
January 25, 2003
May 2, 2009
Leader's seat
Ohio 15th Vermont 5th Rhode Island 2nd (lost re-election)
Last election
143 seats, 37.65%
37 seats, 18.18%
77 seats, 26.26%
Seats before
143
36
77
Seats won
166
103
34
Seat change
Popular vote
5,832,401
4,508,474
2,783,175
Percentage
39.62%
30.63%
18.91%
Swing
pp
pp
pp
Fourth party
Fifth party
Leader
Newt Gingrich
Jesse Ventura
Party
Southern Heritage
Green
Leader since
March 15, 1997
August 27, 2006
Leader's seat
Georgia 6th (lost re-election)
Minnesota 3rd
Last election
49 seats, 9.98%
0 seats, 6.78%
Seats before
47
0
Seats won
4
1
Seat change
Popular vote
889,788
576,221
Percentage
6.04%
3.91%
Swing
pp
Cite error: There are <ref group=lower-alpha> tags or {{efn}} templates on this page, but the references will not show without a {{reflist|group=lower-alpha}} template or {{notelist}} template (see the help page ).
Cite error: There are <ref group=lower-roman> tags or {{efn-lr}} templates on this page, but the references will not show without a {{reflist|group=lower-roman}} template or {{notelist-lr}} template (see the help page ).


