From Wikipedia, the free encyclopedia
Bosshunter351/sandbox|
|
|
|
| Opinion polls |
| Registered | 146,211,960 |
|---|
| Turnout | 96,456,345 |
|---|
|
|
First party
|
Second party
|
Third party
|
|
|

|
|
|
| Candidate
|
Bill Clinton
|
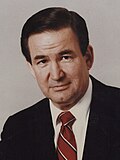
Pat Buchanan
|
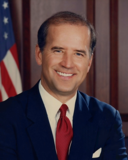
Joe Biden
|
| Party
|
New Democratic
|
Freedom
|
Liberal
|
| Last election
|
33.0%, 204 seats
|
12.7%, 78 seats
|
14.5%, 89 seats
|
| Seats won
|
163
|
109
|
106
|
| Seat change
|
 41 41
|
 31 31
|
 17 17
|
| Popular vote
|
25,512,759
|
17,072,773
|
16,590,491
|
| Percentage
|
26.5%
|
17.7%
|
17.2%
|
| Swing
|
 6.5pp 6.5pp
|
 5.0pp 5.0pp
|
 2.7pp 2.7pp
|
|
|
|
Fourth party
|
Fifth party
|
Sixth party
|
|
|
|
|
|
| Candidate
|
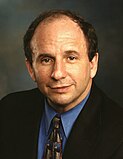
Paul Wellstone
|
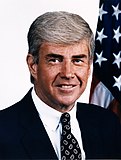
Jack Kemp
|
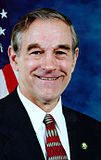
Ron Paul
|
| Party
|
Progressive
|
Conservative
|
Libertarian
|
| Last election
|
21.5%, 132 seats
|
14.8%, 91 seats
|
3.4%, 21 seats
|
| Seats won
|
100
|
96
|
24
|
| Seat change
|
 32 32
|
 5 5
|
 3 3
|
| Popular vote
|
15,722,384
|
15,047,190
|
3,761,797
|
| Percentage
|
16.3%
|
15.6%
|
3.9%
|
| Swing
|
 5.2pp 5.2pp
|
 0.8pp 0.8pp
|
 0.5pp 0.5pp
|
|
|
|
Seventh party
|
|
|
|
|
|
| Candidate
|
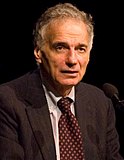
Ralph Nader
|
|
| Party
|
Greens
|
|
| Last election
|
-
|
|
| Seats won
|
17
|
|
| Seat change
|
New
|
|
| Popular vote
|
2,270,906
|
|
| Percentage
|
2.8%
|
|
| Swing
|
New
|
|
|
|
Bosshunter351/sandbox|
|
|
|
| Opinion polls |
| Registered | 126,636,488 |
|---|
| Turnout | 104,423,923 |
|---|
|
|
First party
|
Second party
|
Third party
|
|
|
|
|

|
| Candidate
|
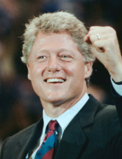
Bill Clinton
|
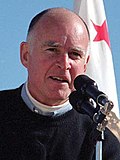
Jerry Brown
|
George H.W. Bush
|
| Party
|
New Democratic
|
Progressive
|
Conservative
|
| Last election
|
14.5%, 89 seats
|
19.3%, 119 seats
|
22.6%, 139 seats
|
| Seats won
|
204
|
132
|
91
|
| Seat change
|
 115 115
|
 13 13
|
 48 48
|
| Popular vote
|
34,459,895
|
22,451,143
|
15,454,741
|
| Percentage
|
33.0%
|
21.5%
|
14.8%
|
| Swing
|
 18.5pp 18.5pp
|
 2.2pp 2.2pp
|
 7.8pp 7.8pp
|
|
|
|
Fourth party
|
Fifth party
|
Sixth party
|
|
|
|

|
|
| Candidate
|
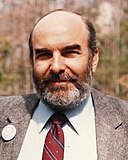
Mario Cuomo
|
Pat Buchanan
|
Andre Marrou
|
| Party
|
Liberal
|
Freedom
|
Libertarian
|
| Last election
|
22.4%, 138 seats
|
18.5%, 114 seats
|
2.6%, 16 seats
|
| Seats won
|
89
|
78
|
21
|
| Seat change
|
 49 49
|
 36 36
|
 5 5
|
| Popular vote
|
15,141,469
|
13,261,838
|
3,550,413
|
| Percentage
|
14.5%
|
12.7%
|
3.4%
|
| Swing
|
 7.9pp 7.9pp
|
 5.8pp 5.8pp
|
 0.8pp 0.8pp
|
|
|
Bosshunter351/sandbox|
|
|
|
| Opinion polls |
| Registered | 77,709,160 |
|---|
| Turnout | 71,920,769 |
|---|
|
|
First party
|
Second party
|
Third party
|
|
|
|
|
|
| Candidate
|
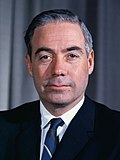
Robert F. Kennedy
|
Hubert Humphrey
|
William Scranton
|
| Party
|
Progressive (CRA)
|
Liberal (CRA)
|
American
|
| Last election
|
12.4%, 76 seats
|
29.8%, 183 seats
|
12.8%, 79 seats
|
| Seats won
|
113
|
100
|
99
|
| Seat change
|
 37 37
|
 83 83
|
 20 20
|
| Popular vote
|
13,233,421
|
11,723,085
|
11,579,244
|
| Percentage
|
18.4%
|
16.3%
|
16.1%
|
| Swing
|
 6.0pp 6.0pp
|
 13.5pp 13.5pp
|
 3.3pp 3.3pp
|
|
|
|
Fourth party
|
Fifth party
|
Sixth party
|
|
|
|
|
|
| Candidate
|
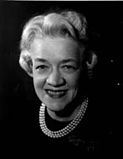
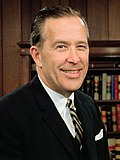
Margaret Chase Smith
|
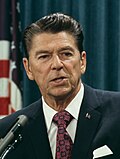
Ronald Reagan
|
Henry M. Jackson
|
| Party
|
Conservative
|
Freedom
|
Labor
|
| Last election
|
13.5%, 83 seats
|
20.2%, 124 seats
|
-
|
| Seats won
|
85
|
81
|
76
|
| Seat change
|
 2 2
|
 43 43
|
New
|
| Popular vote
|
9,925,066
|
9,493,542
|
8,918,175
|
| Percentage
|
13.8%
|
13.2%
|
12.4%
|
| Swing
|
 0.3pp 0.3pp
|
 7.0pp 7.0pp
|
New
|
|
|
|
Seventh party
|
|
|
|
|
|
| Candidate
|
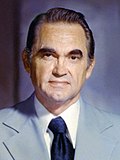
George Wallace
|
|
| Party
|
Workingman's
|
|
| Last election
|
-
|
|
| Seats won
|
61
|
|
| Seat change
|
New
|
|
| Popular vote
|
7,120,156
|
|
| Percentage
|
9.9%
|
|
| Swing
|
New
|
|
|
|
2024 United States Presidential Election in Wisconsin|
|
|
|
 County results
Newsom: 50–60% 60–70% 70–80% 80–90% >90%
DeSantis:
50–60% 60–70% 70–80% 80–90% >90%
Tie: 50% |
|


