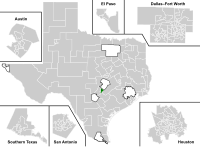
Texas's 45th House of Representatives district
Appearance
| Texas's 45th State House of Representatives district | |||
|---|---|---|---|
 | |||
| Representative |
| ||
| Demographics | 44.8% White 6.2% Black 43.3% Hispanic 4.7% Asian | ||
| Population (2020) • Voting age | 201,407 154,436 | ||
The 45th district of the Texas House of Representatives contains most of Hays county. The current representative is Erin Zwiener, who was first elected in 2018.[1][2]
Representatives
[edit]| Member | Party | Term | |
|---|---|---|---|
| Patrick Rose (San Marcos) | Democratic | 2003–2011 | |
| Jason Isaac (Dripping Springs) | Republican | 2011–2019 | |
| Erin Zwiener (Driftwood) | Democratic | 2019–present | |
Election results
[edit]Elections in the 2020s
[edit]| Party | Candidate | Votes | % | |
|---|---|---|---|---|
| Democratic | Erin Zwiener (incumbent) | 39,078 | 59.2 | |
| Republican | Michelle Lopez | 26,888 | 40.8 | |
| Majority | 12,190 | 18.4 | ||
| Total votes | 65,966 | 100.0 | ||
| Democratic hold | ||||
| Party | Candidate | Votes | % | |
|---|---|---|---|---|
| Democratic | Erin Zwiener (incumbent) | 57,383 | 50.5 | |
| Republican | Carrie Isaac | 56,175 | 49.5 | |
| Majority | 1,208 | 1.0 | ||
| Total votes | 113,558 | 100.0 | ||
| Democratic hold | ||||
Elections in the 2010s
[edit]| Party | Candidate | Votes | % | |
|---|---|---|---|---|
| Democratic | Erin Zwiener (incumbent) | 43,207 | 51.6 | |
| Republican | Ken Strange | 40,531 | 48.4 | |
| Majority | 2,676 | 3.2 | ||
| Total votes | 83,738 | 100.0 | ||
| Democratic gain from Republican | ||||
| Party | Candidate | Votes | % | |
|---|---|---|---|---|
| Republican | Jason Isaac | 47,937 | 100.0 | |
| Total votes | 47,937 | 100.0 | ||
| Republican hold | ||||
| Party | Candidate | Votes | % | |
|---|---|---|---|---|
| Republican | Jason Isaac | 25,739 | 72.6 | |
| Libertarian | Jim Duke | 9,696 | 27.4 | |
| Total votes | 35,435 | 100.0 | ||
| Republican hold | ||||
| Party | Candidate | Votes | % | |
|---|---|---|---|---|
| Republican | Jason Isaac | 33,604 | 53.6 | |
| Democratic | John Adams | 26,557 | 42.4 | |
| Libertarian | Jim Duke | 2,495 | 4.0 | |
| Total votes | 62,656 | 100.0 | ||
| Republican hold | ||||
| Party | Candidate | Votes | % | |
|---|---|---|---|---|
| Republican | Jason Isaac | 27,715 | 53.9 | |
| Democratic | Patrick Rose | 23,691 | 46.1 | |
| Total votes | 51,406 | 100.0 | ||
| Republican gain from Democratic | ||||
References
[edit]- ^ "Texas House of Representatives District 45". Ballotpedia. Retrieved September 25, 2022.
- ^ "District Population Analysis with County Subtotals" (PDF). data.capitol.texas.gov. Texas Legislative Council. Retrieved September 25, 2022.
