From Wikipedia, the free encyclopedia
Side by side comparison| {{Infobox tropical cyclone season}} | {{Infobox tropical cyclone season/sandbox}} |
|---|
| Infobox tropical cyclone season/testcases |
|---|
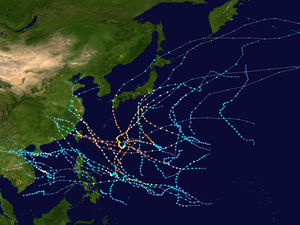
 Season summary map | |
| First system formed | July 31, 2004 |
|---|
| Last system dissipated | December 3, 2004 |
|---|
|
| | Name | Ivan |
|---|
| • Maximum winds | 165 mph (270 km/h) |
|---|
| • Lowest pressure | 910 mbar (hPa; 26.87 inHg) |
|---|
|
| |
| Total depressions | 16 |
|---|
| Total storms | 15 |
|---|
| Hurricanes | 9 |
|---|
Major hurricanes
(Cat. 3+) | 6 |
|---|
| Total fatalities | >3,270 |
|---|
| Total damage | $57.37 billion (2004 USD) |
|---|
|
|
| Atlantic hurricane seasons
2002, 2003, 2004, 2005, 2006 |
|
| Infobox tropical cyclone season/testcases |
|---|
 Season summary map | |
| First system formed | July 31, 2004 |
|---|
| Last system dissipated | December 3, 2004 |
|---|
|
| | Name | Ivan |
|---|
| • Lowest pressure | 910 mbar (hPa) (26.87 inHg) |
|---|
| • Maximum winds | 165 mph (270 km/h) |
|---|
|
| |
| Total depressions | 16 |
|---|
| Total storms | 15 |
|---|
| Hurricanes | 9 |
|---|
Major hurricanes
(Cat. 3+) | 6 |
|---|
| Total fatalities | >3,270 |
|---|
| Total damage | $57.37 billion (2004 USD) |
|---|
|
|
| Atlantic hurricane seasons
2002, 2003, 2004, 2005, 2006 |
|
Side by side comparison| {{Infobox tropical cyclone season}} | {{Infobox tropical cyclone season/sandbox}} |
|---|
| Infobox tropical cyclone season/testcases |
|---|
 Season summary map | |
| First system formed | January 13, 2005 |
|---|
| Last system dissipated | December 22, 2005 |
|---|
|
| | Name | Haitang |
|---|
| • Maximum winds | 195 km/h (120 mph) |
|---|
| • Lowest pressure | 920 hPa (mbar) |
|---|
|
| |
| Total depressions | 33 |
|---|
| Total storms | 24 |
|---|
| Typhoons | 13 |
|---|
| Super typhoons | 3 |
|---|
| Total fatalities | 436 |
|---|
| Total damage | $7.64 billion (2005 USD) |
|---|
|
|
| Pacific typhoon seasons
2003, 2004, 2005, 2006, 2007 |
|
| Infobox tropical cyclone season/testcases |
|---|
 Season summary map | |
| First system formed | January 13, 2005 |
|---|
| Last system dissipated | December 22, 2005 |
|---|
|
| | Name | Haitang |
|---|
| • Lowest pressure | 920 hPa (mbar) |
|---|
| • Maximum winds | 195 km/h (120 mph) |
|---|
|
| |
| Total depressions | 33 |
|---|
| Total storms | 24 |
|---|
| Typhoons | 13 |
|---|
| Super typhoons | 3 |
|---|
| Total fatalities | 436 |
|---|
| Total damage | $7.64 billion (2005 USD) |
|---|
|
|
| Pacific typhoon seasons
2003, 2004, 2005, 2006, 2007 |
|
Side by side comparison| {{Infobox tropical cyclone season}} | {{Infobox tropical cyclone season/sandbox}} |
|---|
| Infobox tropical cyclone season/testcases |
|---|
 Season summary map | |
| First system formed | 7 October 1998 |
|---|
| Last system dissipated | 21 April 1999 |
|---|
|
| | Name | Gwenda |
|---|
| • Maximum winds | 220 km/h (140 mph)
(10-minute sustained) |
|---|
| • Lowest pressure | 900 hPa (mbar) |
|---|
|
| |
| Tropical cyclones | 14 official, 3 unofficial |
|---|
| Tropical cyclones | 9 |
|---|
| Total fatalities | 7 direct, 1 indirect |
|---|
| Total damage | $250 million (1999 USD) |
|---|
|
|
| Australian region tropical cyclone seasons
1996–97, 1997–98, 1998–99, 1999–00, 2000–01 |
|
| Infobox tropical cyclone season/testcases |
|---|
 Season summary map | |
| First system formed | 7 October 1998 |
|---|
| Last system dissipated | 21 April 1999 |
|---|
|
| | Name | Gwenda |
|---|
| • Lowest pressure | 900 hPa (mbar) |
|---|
| • Maximum winds | 220 km/h (140 mph)
(10-minute sustained) |
|---|
|
| |
| Tropical cyclones | 14 official, 3 unofficial |
|---|
| Tropical cyclones | 9 |
|---|
| Total fatalities | 7 direct, 1 indirect |
|---|
| Total damage | $250 million (1999 USD) |
|---|
|
|
| Australian region tropical cyclone seasons
1996–97, 1997–98, 1998–99, 1999–00, 2000–01 |
|


