Talk:Peak oil/sandbox


Untitled
[edit]Peak oil is the point in time when the maximum rate of global petroleum extraction is reached, after which the rate of production enters terminal decline. Peak oil can be reached due to supply constraints. Optimists and pessimists strongly disagree on which way peak oil will happen and the level of economic disruption that will coincide going past the peak.
Constraint caused peak
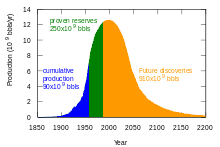
[edit]Because the world's petroleum supply in the ground is effectively fixed, if global oil consumption is not mitigated before the decline phase begins, a world energy crisis may develop because the availability of conventional oil will drop causing prices to rise, perhaps dramatically. M. King Hubbert first used the theory in 1956 to accurately predict that United States oil production would peak between 1965 and 1970. His logistic model, now called Hubbert peak theory, has since been used to predict with reasonable accuracy the peak and decline of petroleum production of many countries, and has also proved useful in other limited-resource production-domains. According to the Hubbert model, the production rate of a limited resource will follow a roughly symmetrical bell-shaped curve based on the limits of exploitability and market pressures. Various modified versions of his original logistic model are used, using more complex functions to allow for real world factors. While each version is applied to a specific domain, the central features of the Hubbert curve (that production stops rising, flattens and then declines) remain unchanged, albeit with different profiles.
- Nature, in this week's issue (link to Nature 481, 433–435 (26 January 2012) doi:10.1038/481433a) shows peak oil through 2011 as never exceeding 76 million barrels/day. Further, they show an apparent produciton cap. This graphic appears to indicate a higher (and ever growing) produciton rate - but it is unclear what the reference is. I think we have a problem here in Wikipedia. — Preceding unsigned comment added by 130.20.3.152 (talk) 23:12, 26 January 2012 (UTC)

