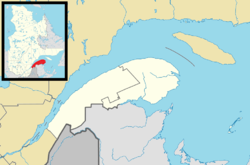
Saint-Joseph-de-Lepage
Saint-Joseph-de-Lepage | |
|---|---|
 Church of Saint-Joseph-de-Lepage | |
 Location within La Mitis RCM | |
| Coordinates: 48°34′33″N 68°10′20″W / 48.5757865°N 68.1721856°W[1] | |
| Country | |
| Province | |
| Region | Bas-Saint-Laurent |
| RCM | La Mitis |
| Constituted | September 29, 1873 |
| Government | |
| • Mayor | Magella Roussel |
| • Federal riding | Haute-Gaspésie—La Mitis—Matane—Matapédia |
| • Prov. riding | Matane-Matapédia |
| Area | |
• Total | 32.00 km2 (12.36 sq mi) |
| • Land | 30.98 km2 (11.96 sq mi) |
| Population | |
• Total | 590 |
| • Density | 19/km2 (50/sq mi) |
| • Pop 2016-2021 | |
| • Dwellings | 260 |
| Time zone | UTC−5 (EST) |
| • Summer (DST) | UTC−4 (EDT) |
| Postal code(s) | |
| Area code(s) | 418 and 581 |
| Highways | |
| Website | www |
Saint-Joseph-de-Lepage is a parish municipality in La Mitis Regional County Municipality in the Bas-Saint-Laurent region of Quebec, Canada.
It is located 5 km south-east of Mont-Joli in the Matapédia River Valley. The village is 350 km north east of Québec city and 360 km west of Gaspé. The nearest towns are Mont-Joli, and Rimouski which lies 40 km to the south-east.
Saint-Joseph-de-Lepage takes its name from the colonial lordship, the Seigneurie Lepage-et-Thibierge, which was the early governance of the area. Its 500 residents work largely in agriculture and forestry.[4]
The ecclesiastical parish of the same name is in the Archdiocese of Rimouski.
History
[edit]The territory occupied by the parish municipality of Saint-Joseph-de-Lepage was first granted to Gabriel Thivierge and Louis Lepage and became known as the seigneury of Lepage-et-Thivierge. Later, this seigneury became the Seignory of Rimouski, which for a long time belonged to the Lepage family. The parish of Saint-Joseph-de-Lepage was canonically erected on 21 April 1873. The municipality of Saint-Joseph-de-Lepage was officially created on 29 September 1873 by a detachment from Sainte-Flavie. The presbytery was built in 1873. The wooden church was built in 1875. The caisse populaire was founded on March 7, 1940.[1]
Demographics
[edit]In the 2021 Census of Population conducted by Statistics Canada, Saint-Joseph-de-Lepage had a population of 590 living in 223 of its 260 total private dwellings, a change of 12.8% from its 2016 population of 523. With a land area of 30.98 km2 (11.96 sq mi), it had a population density of 19.0/km2 (49.3/sq mi) in 2021.[5]
Population trend:[6]
- Population in 2021: 590 (12.8% increase from 2016)
- Population in 2016: 523 (0.8% decrease from 2011)
- Population in 2011: 527 (3.3% decrease from 2006)
- Population in 2006: 545 (7.0% decrease from 2001)
- Population in 2001: 586
- Population in 1996: 587
- Population in 1991: 590
- Population in 1986: 613
- Population in 1981: 507
- Population in 1976: 392
- Population in 1971: 379
- Population in 1966: 434
- Population in 1961: 450
- Population in 1956: 463
- Population in 1951: 447
- Population in 1941: 521
- Population in 1931: 583
- Population in 1921: 481
- Population in 1911: 400
- Population in 1901: 414
- Population in 1891: 401
- Population in 1881: 556
Private dwellings (occupied by usual residents): 223
Languages:
- French as first language: 98.3%
- English as first language: 0.8%
See also
[edit]References
[edit]- ^ a b "Banque de noms de lieux du Québec: Reference number 56995". toponymie.gouv.qc.ca (in French). Commission de toponymie du Québec.
- ^ a b "Répertoire des municipalités: Geographic code 09070". www.mamh.gouv.qc.ca (in French). Ministère des Affaires municipales et de l'Habitation.
- ^ a b "Profile table, Census Profile, 2021 Census of Population - Saint-Joseph-de-Lepage, Paroisse (Municipalité de) (PE) [Census subdivision], Quebec". 9 February 2022.
- ^ fr:Saint-Joseph-de-Lepage
- ^ "Population and dwelling counts: Canada, provinces and territories, and census subdivisions (municipalities), Quebec". Statistics Canada. February 9, 2022. Retrieved August 29, 2022.
- ^ Statistics Canada: 1996, 2001, 2006, 2011, 2016, 2021 census
External links
[edit] Media related to Saint-Joseph-de-Lepage at Wikimedia Commons

