Reagan coalition
This article needs additional citations for verification. (November 2023) |

| ||
|---|---|---|
|
Entertainment and personal 33rd Governor of California 40th President of the United States Tenure Appointments
|
||
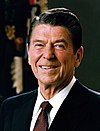
The Reagan coalition was the combination of voters that Republican Ronald Reagan assembled to produce a major political realignment with his electoral landslide in the 1980 United States presidential election. The coalition was possible because of Democrat Jimmy Carter's losses in most social-economic groups. In 1984, Reagan confirmed his support by winning nearly 60% of the popular vote and carried 49 of the 50 states.
The Reagan Democrats were members of the Democratic Party before and after the Reagan presidency, but voted for Reagan in 1980 and 1984 and for his vice president, George H. W. Bush, in 1988, producing their landslide victories. They were mostly white socially conservative blue-collar workers who lived in the Northeast and were attracted to Reagan's social conservatism on issues such as abortion and to his hawkish foreign policy. They did not continue to vote Republican in 1992 or 1996, causing the term to fall into disuse except as a reference to the 1980s. The term is not generally used to describe the white Southerners who permanently changed party affiliation from Democrat to Republican during Reagan's presidency. They have largely remained Republican to this day.
Democratic pollster Stan Greenberg analyzed white, largely unionized auto workers in suburban Macomb County, Michigan, just north of Detroit. The county voted 63% for John F. Kennedy in the 1960 presidential election and 66% for Reagan in 1984. He concluded that Reagan Democrats no longer saw Democrats as champions of their middle class aspirations. They instead viewed the Democratic Party as working primarily for the benefit of others, especially African Americans and the very poor.
The Reagan coalition began to fall apart after 1988 when Reagan was ineligible for reelection and Bush won over Democrat Michael Dukakis. Bush lost over 5 million votes and 100 electoral votes in comparison to what Reagan won four years prior. In 1992, Bush faced a competitive primary competition with Pat Buchanan, still winning the Republican nomination with 72% of the vote. Bush went on to lose the general election against Democrat Bill Clinton, with exit polling showing Bush retaining 66% of the Republican vote, Clinton winning 12%, and independent candidate Ross Perot winning 21%. In 1996, Republican Bob Dole lost to Clinton, taking 68% of the Republican vote, improving on Bush's margin, while Clinton took 23% and Perot 7%.
Voter demographics
[edit]| 1980 and 1976 voter groups and presidential votes | ||||||
|---|---|---|---|---|---|---|
| % of the total 1980 vote | ||||||
| Group | Carter (1980) | Reagan (1980) | Anderson (1980) | Carter (1976) | Ford (1976) | |
| Party | ||||||
| 43 | Democratic | 65 | 26 | 6 | 77 | 22 |
| 23 | Independent | 30 | 54 | 12 | 43 | 54 |
| 28 | Republican | 11 | 84 | 4 | 9 | 90 |
| Ideology | ||||||
| 18 | Liberal | 57 | 27 | 11 | 70 | 26 |
| 51 | Moderate | 42 | 48 | 8 | 51 | 48 |
| 31 | Conservative | 23 | 71 | 4 | 29 | 70 |
| Race | ||||||
| 10 | Black | 82 | 14 | 3 | 82 | 16 |
| 2 | Hispanic | 54 | 36 | 7 | 75 | 24 |
| 88 | White | 36 | 55 | 8 | 47 | 52 |
| Sex | ||||||
| 48 | Female | 45 | 46 | 7 | 50 | 48 |
| 52 | Male | 37 | 54 | 7 | 50 | 48 |
| Religion | ||||||
| 46 | Protestant | 37 | 56 | 6 | 44 | 55 |
| 41 | White Protestant | 31 | 62 | 6 | 43 | 57 |
| 25 | Catholic | 40 | 51 | 7 | 54 | 44 |
| 5 | Jewish | 45 | 39 | 14 | 64 | 34 |
| Family income | ||||||
| 13 | Less than $10,000 | 50 | 41 | 6 | 58 | 40 |
| 15 | $10,000–$14,999 | 47 | 42 | 8 | 55 | 43 |
| 29 | $15,000–$24,999 | 38 | 53 | 7 | 48 | 50 |
| 24 | $25,000–$50,000 | 32 | 58 | 8 | 36 | 62 |
| 5 | Over $50,000 | 25 | 65 | 8 | — | — |
| Occupation | ||||||
| 39 | Professional or manager | 33 | 56 | 9 | 41 | 57 |
| 11 | Clerical, sales, white collar | 42 | 48 | 8 | 46 | 53 |
| 17 | Blue-collar | 46 | 47 | 5 | 57 | 41 |
| 3 | Agriculture | 29 | 66 | 3 | — | — |
| 3 | Unemployed | 55 | 35 | 7 | 65 | 34 |
| Education | ||||||
| 11 | Less than high school | 50 | 45 | 3 | 58 | 41 |
| 28 | High school graduate | 43 | 51 | 4 | 54 | 46 |
| 28 | Some college | 35 | 55 | 8 | 51 | 49 |
| 27 | College graduate | 35 | 51 | 11 | 45 | 55 |
| Union membership | ||||||
| 28 | Labor union household | 47 | 44 | 7 | 59 | 39 |
| 62 | No member of household in union | 35 | 55 | 8 | 43 | 55 |
| Age | ||||||
| 6 | 18–21 years old | 44 | 43 | 11 | 48 | 50 |
| 17 | 22–29 years old | 43 | 43 | 11 | 51 | 46 |
| 31 | 30–44 years old | 37 | 54 | 7 | 49 | 49 |
| 23 | 45–59 years old | 39 | 55 | 6 | 47 | 52 |
| 18 | 60 years or older | 40 | 54 | 4 | 47 | 52 |
| Region | ||||||
| 25 | East | 42 | 47 | 9 | 51 | 47 |
| 27 | South | 44 | 51 | 3 | 54 | 45 |
| 22 | South (whites) | 35 | 60 | 3 | 46 | 52 |
| 27 | Midwest | 40 | 51 | 7 | 48 | 50 |
| 19 | Far West | 35 | 53 | 9 | 46 | 51 |
| Community size | ||||||
| 18 | City over 250,000 | 54 | 35 | 8 | 60 | 40 |
| 53 | Suburb/small city | 37 | 53 | 8 | 53 | 47 |
| 29 | Rural/town | 39 | 54 | 5 | 47 | 53 |
| Source:[1] | ||||||
See also
[edit]Citations
[edit]- ^ CBS News/The New York Times interviews with 12,782 voters as they left the polls as reported in The New York Times, November 9, 1980, p. 28. 1976 data are from CBS News interviews.
Further reading
[edit]- Ehrman, John. The Eighties: America in the Age of Reagan. (2005).
- Ferguson Thomas, and Joel Rogers, Right Turn: The Decline of the Democrats and the Future of American Politics 1986.
- Germond, Jack W. and Jules Witcover. Blue Smoke & Mirrors: How Reagan Won & Why Carter Lost the Election of 1980. 1981. Detailed journalism.
- Greenberg, Stan. Middle Class Dreams: The Politics and Power of the New American Majority (1985).
- Jensen, Richard J., Steven L. Piott, Christopher C. Gibbs; Grass Roots Politics: Parties, Issues, and Voters, 1854-1983 Greenwood Press, 1983.
- Nelson Michael ed. The Elections of 1984 1985.
- Patterson, James T. Restless Giant: The United States from Watergate to Bush vs. Gore. (2005), standard scholarly synthesis.
- Pemberton, William E. Exit with Honor: The Life and Presidency of Ronald Reagan (1998).
- Troy, Gill. Morning in America: How Ronald Reagan Invented the 1980s (2004). Study of Reagan's image.


