Portsmouth City Council elections
Appearance
(Redirected from Portsmouth local elections)
Portsmouth City Council is the local authority for the unitary authority of Portsmouth in Hampshire, England. Until 1 April 1997 it was a non-metropolitan district.
Political control
[edit]Since the first election to the council in 1973 following the reforms of the Local Government Act 1972, political control of the council has been held by the following parties:[1]
Non-metropolitan district
| Election | Overall Control | Conservative | Labour | Alliance/Liberal Democrats | Independent | ||
|---|---|---|---|---|---|---|---|
| 1973 | Conservative | 28 | 17 | 0 | 3 | 48 | |
| 1976 | Conservative | 31 | 14 | 0 | 3 | ||
| 1979 | Conservative | 31 | 14 | 0 | 3 | ||
| 1983 | Conservative | 25 | 11 | 1 | 2 | 39 | |
| 1984 | Conservative | 25 | 11 | 1 | 2 | ||
| 1986 | Conservative | 23 | 10 | 5 | 1 | ||
| 1987 | Conservative | 24 | 9 | 5 | 1 | ||
| 1988 | Conservative | 25 | 8 | 5 | 1 | ||
| 1990 | Conservative | 21 | 12 | 5 | 1 | ||
| 1991 | No overall control (Conservative administration) |
19 | 13 | 6 | 1 | ||
| 1992 | No overall control (Conservative administration) |
17 | 14 | 7 | 1 | ||
| 1994 | No overall control (Labour administration) |
15 | 14 | 9 | 1 | ||
| 1995 | No overall control (Labour administration) |
11 | 18 | 10 | 0 | ||
| 1996 | Labour | 6 | 21 | 12 | 0 | ||
Unitary authority
| Party in control | Years | |
|---|---|---|
| Labour | 1997–2000 | |
| No overall control | 2000–2009 | |
| Liberal Democrats | 2009–2014[2] | |
| No overall control | 2014–present | |
Council elections
[edit]Non-metropolitan district elections
[edit]- 1973 Portsmouth City Council election
- 1976 Portsmouth City Council election
- 1979 Portsmouth City Council election
- 1983 Portsmouth City Council election (New ward boundaries)[3]
- 1984 Portsmouth City Council election
- 1986 Portsmouth City Council election
- 1987 Portsmouth City Council election
- 1988 Portsmouth City Council election
- 1990 Portsmouth City Council election
- 1991 Portsmouth City Council election
- 1992 Portsmouth City Council election
- 1994 Portsmouth City Council election
- 1995 Portsmouth City Council election
- 1996 Portsmouth City Council election
Unitary authority elections
[edit]- 1998 Portsmouth City Council election
- 1999 Portsmouth City Council election
- 2000 Portsmouth City Council election
- 2002 Portsmouth City Council election (New ward boundaries increased the number of seats by 3)[4][5]
- 2003 Portsmouth City Council election
- 2004 Portsmouth City Council election
- 2006 Portsmouth City Council election
- 2007 Portsmouth City Council election
- 2008 Portsmouth City Council election
- 2010 Portsmouth City Council election
- 2011 Portsmouth City Council election
- 2012 Portsmouth City Council election
- 2014 Portsmouth City Council election
- 2015 Portsmouth City Council election
- 2016 Portsmouth City Council election
- 2018 Portsmouth City Council election
- 2019 Portsmouth City Council election
- 2021 Portsmouth City Council election
- 2022 Portsmouth City Council election
- 2023 Portsmouth City Council election
- 2024 Portsmouth City Council election
City result maps
[edit]-
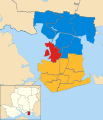
2002 results map
-
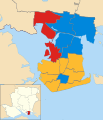
2003 results map
-
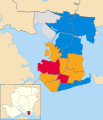
2004 results map
-
2006 results map
-
2007 results map
-
2008 results map
-
2010 results map
-
2011 results map
-
2012 results map
-
2014 results map
-
2015 results map
-
2016 results map
-
2018 results map
-
2019 results map
-
2021 results map
-
2022 results map
-
2023 results map
-
2024 results map
By-election results
[edit]2002-2006
[edit]| Party | Candidate | Votes | % | ±% | |
|---|---|---|---|---|---|
| Conservative | Stephen Wemyss | 2,148 | 50.9 | +4.2 | |
| Liberal Democrats | Patrict Whittle | 1,973 | 46.7 | +4.3 | |
| English Democrat | David Knight | 102 | 2.4 | +2.4 | |
| Majority | 175 | 4.2 | |||
| Turnout | 4,223 | 43.0 | |||
| Conservative hold | Swing | ||||
2006-2010
[edit]| Party | Candidate | Votes | % | ±% | |
|---|---|---|---|---|---|
| Liberal Democrats | David Fuller | 1,196 | 58.6 | +2.6 | |
| Conservative | Gerry Oldfield | 496 | 24.3 | +1.3 | |
| Labour | Simon Payne | 144 | 7.1 | −5.4 | |
| English Democrat | David Knight | 131 | 6.4 | −2.1 | |
| Green | Sean Sanders | 56 | 2.7 | +2.7 | |
| Independent | Mark Austin | 17 | 0.8 | +0.8 | |
| Majority | 700 | 34.3 | +1.3 | ||
| Turnout | 2,040 | 20.7 | |||
| Liberal Democrats hold | Swing | ||||
| Party | Candidate | Votes | % | ±% | |
|---|---|---|---|---|---|
| Labour | Sarah Cook | 791 | 35.0 | +3.2 | |
| Conservative | Jim Fleming | 682 | 30.2 | +3.3 | |
| Liberal Democrats | Alex Naylor | 548 | 24.2 | −2.9 | |
| UKIP | Michelle Essery | 90 | 4.0 | +4.0 | |
| Green | Calum Kennedy | 78 | 3.5 | −2.9 | |
| English Democrat | Clive Percy | 71 | 3.1 | −4.4 | |
| Majority | 109 | 4.8 | |||
| Turnout | 2,260 | 22.4 | |||
| Labour hold | Swing | ||||
| Party | Candidate | Votes | % | ±% | |
|---|---|---|---|---|---|
| Liberal Democrats | Andy Fraser | 1,835 | 55.8 | +38.4 | |
| Conservative | Jim Fleming | 904 | 27.5 | −18.6 | |
| Labour | Terry O'Brien | 349 | 10.6 | −8.2 | |
| English Democrat | David Knight | 117 | 3.6 | −13.6 | |
| UKIP | Michelle Essery | 57 | 1.7 | +1.7 | |
| Independent | Mark Austin | 28 | 0.9 | +0.9 | |
| Majority | 931 | 28.3 | |||
| Turnout | 3,290 | 33.9 | |||
| Liberal Democrats gain from Conservative | Swing | ||||
References
[edit]- ^ "Council compositions". The Elections Centre. Retrieved 3 May 2016.
- ^ "Lib Dems claim fourth defection". BBC News Online. 27 January 2009. Retrieved 31 August 2009.
- ^ legislation.gov.uk - The City of Portsmouth (Electoral Arrangements) Order 1979. Retrieved on 19 November 2015.
- ^ "Portsmouth". * BBC News Online. Retrieved 31 August 2009.
- ^ legislation.gov.uk - The City of Portsmouth (Electoral Changes) Order 2001. Retrieved on 4 October 2015.
- ^ "Drayton & Farlington Ward By-election - 1 September 2005". Portsmouth City Council. Archived from the original on 7 January 2009. Retrieved 31 August 2009.
- ^ "Fratton Ward by-election 2007 results". Portsmouth City Council. Archived from the original on 14 May 2010. Retrieved 31 August 2009.
- ^ "Nelson Ward by-election 2007 results". Portsmouth City Council. Retrieved 31 August 2009.
- ^ "Copnor Ward by-election 2008 results". Portsmouth City Council. Retrieved 31 August 2009.


