Leicester City Council elections
Appearance
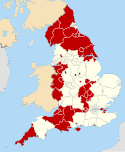
Leicester City Council elections are held every four years. Leicester City Council is the local authority for the unitary authority of Leicester in Leicestershire, England. Until 1 April 1997 it was a non-metropolitan district. Since 2011 it has also had a directly elected mayor. Since the last boundary changes in 2015, 54 councillors have been elected from 21 wards.[1]
Summary of results
[edit]| Political group | Councillors | |||||||||
|---|---|---|---|---|---|---|---|---|---|---|
| 1996 | 1999 | 2003 | 2007 | 2011 | 2015 | 2019 | 2023 | Current | ||
| Labour | 41 | 30 | 20 | 38 | 52 | 52 | 53 | 31 | 31 | |
| Liberal Democrat | 8 | 16 | 25 | 6 | 1 | 1 | 1 | 3 | 3 | |
| Conservative | 7 | 10 | 9 | 8 | 1 | 1 | 0 | 17 | 17 | |
| Green | 0 | 0 | 0 | 2 | 0 | 0 | 0 | 3 | 3 | |
| Independent | 0 | 0 | 0 | 0 | 0 | 0 | 0 | 0 | 0 | |
| Total | 56 | 56 | 54 | 54 | 54 | 54 | 54 | 54 | 54 | |
Council elections
[edit]- 1973 Leicester City Council election
- 1976 Leicester City Council election
- 1979 Leicester City Council election
- 1983 Leicester City Council election (New ward boundaries)[2]
- 1984 Leicester City Council election
- 1986 Leicester City Council election
- 1987 Leicester City Council election
- 1991 Leicester City Council election (City boundary changes took place but the number of seats remained the same)[3]
- 1995 Leicester City Council election
- 1996 Leicester City Council election
- 1998 Leicester City Council election
- 1999 Leicester City Council election
- 2003 Leicester City Council election (New ward boundaries reduced the number of seats by 2)[4][5][6]
- 2007 Leicester City Council election
- 2011 Leicester City Council election
- 2015 Leicester City Council election (New ward boundaries)[1]
- 2019 Leicester City Council election
- 2023 Leicester City Council election
Mayoral elections
[edit]- Leicester mayoral election, 2011
- Leicester mayoral election, 2015
- Leicester mayoral election, 2019
- Leicester mayoral election, 2023
Results maps
[edit]-
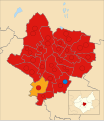
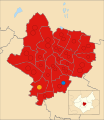
2011 results map
-
2015 results map
-
2019 results map
-
2023 results map
By-election results
[edit]1995-1999
[edit]| Party | Candidate | Votes | % | ±% | |
|---|---|---|---|---|---|
| Labour | 1,608 | 69.3 | |||
| Conservative | 461 | 19.9 | |||
| Liberal Democrats | 140 | 6.0 | |||
| Socialist Labour | 112 | 4.8 | |||
| Majority | 1,147 | 49.4 | |||
| Turnout | 2,321 | 37.1 | |||
| Labour hold | Swing | ||||
| Party | Candidate | Votes | % | ±% | |
|---|---|---|---|---|---|
| Liberal Democrats | 744 | 51.8 | +38.8 | ||
| Labour | 318 | 22.2 | −38.2 | ||
| Conservative | 282 | 19.7 | −1.2 | ||
| Socialist Labour | 91 | 6.3 | +6.3 | ||
| Majority | 426 | 29.6 | |||
| Turnout | 1,435 | ||||
| Liberal Democrats gain from Labour | Swing | ||||
| Party | Candidate | Votes | % | ±% | |
|---|---|---|---|---|---|
| Labour | 1,205 | 56.0 | −5.1 | ||
| Conservative | 513 | 23.8 | +13.8 | ||
| Liberal Democrats | 334 | 15.5 | +1.5 | ||
| Socialist Labour | 101 | 4.7 | +4.7 | ||
| Majority | 692 | 32.2 | |||
| Turnout | 2,153 | ||||
| Labour hold | Swing | ||||
| Party | Candidate | Votes | % | ±% | |
|---|---|---|---|---|---|
| Labour | 839 | 46.7 | −14.8 | ||
| Liberal Democrats | 376 | 20.9 | +8.6 | ||
| Conservative | 374 | 20.8 | +2.3 | ||
| Green | 125 | 7.0 | −0.7 | ||
| Socialist Labour | 81 | 4.5 | +4.5 | ||
| Majority | 463 | 25.8 | |||
| Turnout | 1,795 | ||||
| Labour hold | Swing | ||||
1999-2003
[edit]| Party | Candidate | Votes | % | ±% | |
|---|---|---|---|---|---|
| Conservative | Jean Middleton | 955 | 43.1 | −5.2 | |
| Liberal Democrats | Alison Bannatyne | 683 | 30.8 | +18.5 | |
| Labour | Patrick Kitterick | 525 | 23.7 | −10.8 | |
| Green | Anthony Walker | 51 | 2.3 | −2.6 | |
| Majority | 272 | 12.3 | |||
| Turnout | 2,214 | 28.8 | |||
| Conservative hold | Swing | ||||
| Party | Candidate | Votes | % | ±% | |
|---|---|---|---|---|---|
| Conservative | 1,060 | 43.7 | −11.3 | ||
| Labour | 640 | 26.4 | −9.5 | ||
| Liberal Democrats | 544 | 22.4 | +13.3 | ||
| BNP | 115 | 4.7 | +4.7 | ||
| Independent | 67 | 2.8 | +2.8 | ||
| Majority | 420 | 17.3 | |||
| Turnout | 2,426 | 32.4 | |||
| Conservative hold | Swing | ||||
| Party | Candidate | Votes | % | ±% | |
|---|---|---|---|---|---|
| Liberal Democrats | M Farmer | 998 | 41.2 | +18.4 | |
| Labour | J Blackmore | 905 | 37.3 | −9.3 | |
| Conservative | D Keeling | 232 | 9.6 | +0.0 | |
| BNP | E Scott | 202 | 8.3 | +8.3 | |
| Green | T O'Connel | 66 | 2.7 | +2.7 | |
| Socialist Labour | D Roberts | 22 | 0.9 | +0.9 | |
| Majority | 93 | 3.9 | |||
| Turnout | 2,425 | 39.6 | |||
| Liberal Democrats gain from Labour | Swing | ||||
2003-2007
[edit]| Party | Candidate | Votes | % | ±% | |
|---|---|---|---|---|---|
| Liberal Democrats | A Tessier | 742 | 47.4 | +8.4 | |
| Labour | N Holden | 543 | 34.7 | −6.4 | |
| Conservative | R Taylor | 113 | 7.2 | −5.3 | |
| Socialist Labour | V Smalley | 101 | 6.5 | +6.5 | |
| BNP | K Yates | 66 | 4.2 | +4.2 | |
| Majority | 199 | 12.7 | |||
| Turnout | 1,565 | 25.2 | |||
| Liberal Democrats hold | Swing | ||||
| Party | Candidate | Votes | % | ±% | |
|---|---|---|---|---|---|
| Conservative | Nigel Porter | 938 | 45.8 | −5.0 | |
| Liberal Democrats | R Webber-Jones | 494 | 24.1 | +2.1 | |
| Labour | R Craven-Griffiths | 443 | 21.7 | +2.3 | |
| Green | R Ball | 171 | 8.4 | +0.6 | |
| Majority | 444 | 21.7 | |||
| Turnout | 2,046 | 25.4 | |||
| Conservative hold | Swing | ||||
| Party | Candidate | Votes | % | ±% | |
|---|---|---|---|---|---|
| Conservative | R Grant | 1,646 | 45.9 | +14.4 | |
| Liberal Democrats | J Bhoot | 1,089 | 30.4 | −14.3 | |
| Labour | B Fairbairn | 605 | 16.9 | +1.7 | |
| Green | M Follet | 247 | 6.9 | −1.8 | |
| Majority | 557 | 15.5 | |||
| Turnout | 3,587 | 28.3 | |||
| Conservative gain from Liberal Democrats | Swing | ||||
| Party | Candidate | Votes | % | ±% | |
|---|---|---|---|---|---|
| Labour | A Kavia | 1,809 | 65.4 | +16.7 | |
| Conservative | S Gajjar | 459 | 16.6 | +6.6 | |
| Liberal Democrats | P Jethwa | 349 | 12.6 | −2.7 | |
| Green | G Force | 151 | 5.5 | +1.7 | |
| Majority | 1,350 | 48.8 | |||
| Turnout | 2,768 | 36.6 | |||
| Labour hold | Swing | ||||
| Party | Candidate | Votes | % | ±% | |
|---|---|---|---|---|---|
| Labour | Violet Dempster | 952 | 54.4 | +5.9 | |
| Conservative | Martin Wright | 342 | 19.5 | −7.6 | |
| Liberal Democrats | John Taylor | 295 | 16.8 | −4.5 | |
| BNP | John Chapman | 161 | 9.2 | +9.2 | |
| Majority | 610 | 34.9 | |||
| Turnout | 1,750 | 18.2 | |||
| Labour hold | Swing | ||||
| Party | Candidate | Votes | % | ±% | |
|---|---|---|---|---|---|
| Labour | 1,751 | 66.1 | +0.7 | ||
| Liberal Democrats | Rukmani Patel | 509 | 19.2 | +6.6 | |
| Conservative | 265 | 10.0 | −6.6 | ||
| Green | 122 | 4.6 | −0.9 | ||
| Majority | 1,242 | 46.9 | +10.2 | ||
| Turnout | 2,647 | 34.3 | −2.4 | ||
| Labour hold | Swing | ||||
2007-2011
[edit]| Party | Candidate | Votes | % | ±% | |
|---|---|---|---|---|---|
| Labour | Lynn Senior | 611 | 31.7 | +5.1 | |
| Green | Dave Dixey | 519 | 26.9 | −8.6 | |
| Conservative | Jacob Wilkinson | 435 | 22.6 | +7.2 | |
| Liberal Democrats | Joan Garrity | 292 | 15.1 | −3.1 | |
| UKIP | Zoey Lucas | 41 | 2.1 | −0.5 | |
| Liberal | Gareth Henry | 31 | 1.6 | −0.1 | |
| Majority | 92 | 4.8 | |||
| Turnout | 1,929 | 12.7 | |||
| Labour gain from Green | Swing | +6.8 | |||
| Party | Candidate | Votes | % | ±% | |
|---|---|---|---|---|---|
| Labour | Virginia Cleaver | 1,446 | 35.3 | −2.5 | |
| Conservative | Jon Humberstone | 999 | 24.4 | +2.8 | |
| Liberal Democrats | Scott Kennedy-Lount | 908 | 22.2 | +5.8 | |
| BNP | Adrian Waudby | 745 | 18.2 | −3.2 | |
| Majority | 447 | 10.9 | |||
| Turnout | 4,098 | ||||
| Labour hold | Swing | -2.65 | |||
2011-2015
[edit]| Party | Candidate | Votes | % | ±% | |
|---|---|---|---|---|---|
| Labour | Vijay Singh Riyait | 1,190 | 47.9 | +0.8 | |
| Conservative | Dipak Joshi | 562 | 22.6 | +9.0 | |
| Independent | Terry McGreal | 352 | 14.1 | n/a | |
| Liberal Democrats | John Robert Taylor | 212 | 8.5 | +1.8 | |
| TUSC | Tessa Warrington | 165 | 6.6 | n/a | |
| Majority | 628 | 25.3 | |||
| Turnout | 2,481 | 24.1 | |||
| Labour hold | Swing | -7.5 | |||
2015-2019
[edit]| Party | Candidate | Votes | % | ±% | |
|---|---|---|---|---|---|
| Labour | Danny Myers | 4,272 | 64.6 | +27.3 | |
| Conservative | Ali Douas | 1,015 | 15.4 | −2.1 | |
| Green | Oli Young-Jones | 946 | 14.3 | −13.5 | |
| Liberal Democrats | Lewis Hastie | 379 | 5.7 | −3.0 | |
| Majority | 3,257 | 49.3 | |||
| Turnout | 6,612 | ||||
| Labour hold | Swing | ||||
| Party | Candidate | Votes | % | ±% | |
|---|---|---|---|---|---|
| Labour | Elaine Pantling | 556 | 53.15 | ||
| Liberal Democrats | Tony Faithfull-Wright | 320 | 30.59 | ||
| Conservative | Christopher Michael Doyle | 170 | 15.91 | ||
| Majority | 236 | ||||
| Turnout | 1046 | 12.5 | |||
| Labour hold | Swing | ||||
| Party | Candidate | Votes | % | ±% | |
|---|---|---|---|---|---|
| Labour | Padmini Chamund | 5,477 | 86.6 | +17.0 | |
| Conservative | Khandubhai Patel | 412 | 6.5 | −11.9 | |
| Liberal Democrats | Hash Chandarana | 238 | 3.8 | +3.8 | |
| Green | Ursula Bilson | 199 | 3.1 | −2.6 | |
| Majority | 5,065 | 80.1 | |||
| Turnout | 6,326 | ||||
| Labour hold | Swing | ||||
2019-2023
[edit]| Party | Candidate | Votes | % | ±% | |
|---|---|---|---|---|---|
| Labour | Vandevi Pandya | 3,306 | 47.2% | ||
| Conservative | Abdul Osman | 2565 | 36.6% | ||
| Green | Aasiya Bora | 241 | 3.4% | ||
| Liberal Democrats | Asit Sodha | 240 | 3.4% | ||
| TUSC | Kumaran Bose | 117 | 1.7% | ||
| Reform UK | Raj Solanki | 89 | 1.3% | ||
| For Britain | David Haslett | 69 | 1.0% | ||
| Independent | Charnjit Singh Sagoo | 61 | 0.9% | ||
| Communist | Andrea Burford | 33 | 0.5% | ||
| Majority | 741 | 10.6% | |||
| Turnout | 7,004 | 45.0% | |||
| Labour hold | Swing | -26.5 | |||
| Party | Candidate | Votes | % | ±% | |
|---|---|---|---|---|---|
| Conservative | Daniel Crewe | 1,062 | 44.7% | ||
| Labour | Abdul Jalil | 790 | 33.2% | ||
| Liberal Democrats | Bicram Athwal | 262 | 11.0% | ||
| Green | Pam Bellinger | 190 | 8.0% | ||
| Reform UK | Raj Solanki | 37 | 1.6% | ||
| For Britain | David Haslett | 37 | 1.6% | ||
| Majority | 272 | 11.5 | |||
| Conservative gain from Labour | Swing | 17.0% | |||
| Party | Candidate | Votes | % | ±% | |
|---|---|---|---|---|---|
| Labour | Shahid Ullah Khan | 1,557 | 38.8 | −20.8 | |
| Conservative | Jenny Joannuo | 1382 | 34.4 | +11.9 | |
| Liberal Democrats | Zuffar Haq | 830 | 20.7 | +12.2 | |
| Green | Ursula Bilson | 200 | 5.0 | −7.6 | |
| For Britain | David George | 45 | 1.1 | +1.1 | |
| Majority | 175 | 4.4 | −22.4 | ||
| Turnout | 4014 | 30.7 | −5.3 | ||
| Labour hold | Swing | -16.4 | |||
| Party | Candidate | Votes | % | ±% | |
|---|---|---|---|---|---|
| Conservative | Sanjay Modhwadia | 3,441 | 49.6% | ||
| Green | Aasiya Bora | 1,790 | 25.8% | ||
| Labour | Rajul Tejura | 1,563 | 22.5% | ||
| Liberal Democrats | Jitesh Dave | 100 | 1.4% | ||
| TUSC | Tessa Warrington | 45 | 0.6% | ||
| Majority | 1,651 | 23.8% | |||
| Turnout | 6,934 | ||||
| Conservative gain from Labour | Swing | 41.3% | |||
References
[edit]- ^ a b "The Leicester (Electoral Changes) Order 2014", legislation.gov.uk, The National Archives, SI 2014/3339, retrieved 17 August 2022
- ^ legislation.gov.uk - The City of Leicester (Electoral Arrangements) Order 1979. Retrieved on 19 November 2015.
- ^ legislation.gov.uk - The Leicestershire (District Boundaries) Order 1987. Retrieved on 6 November 2015.
- ^ legislation.gov.uk - The City of Leicester (Electoral Changes) Order 2002. Retrieved on 4 October 2015.
- ^ "Local elections". BBC News Online. Retrieved 7 September 2009.
- ^ "Councillors, Democracy and Elections". Leicester City Council. Retrieved 7 September 2009.
- ^ "Eyres Monsell Ward May 2002". Leicester City Council. Archived from the original on 27 August 2002. Retrieved 7 September 2009.
- ^ "Westcotes Ward 11th December 2003". Leicester City Council. Archived from the original on 14 June 2011. Retrieved 7 September 2009.
- ^ "Aylestone Ward 23rd September 2004". Leicester City Council. Archived from the original on 14 June 2011. Retrieved 7 September 2009.
- ^ "Knighton Ward 4th November 2004". Leicester City Council. Archived from the original on 14 June 2011. Retrieved 7 September 2009.
- ^ "Belgrave Ward 17th February 2005". Leicester City Council. Archived from the original on 16 January 2006. Retrieved 7 September 2009.
- ^ a b "Strong swing to Labour in local byelections". guardian.co.uk. 15 July 2005. Retrieved 7 September 2009.
- ^ "Victory for Labour at Leicester by-election". this is leicestershire.co.uk. 11 September 2009. Archived from the original on 5 May 2013. Retrieved 23 September 2009.
- ^ "Local issues will decide poll result, say hopefuls". this is leicestershire.co.uk. 18 August 2009. Archived from the original on 5 May 2013. Retrieved 23 September 2009.
- ^ "Eyres Monsell By-Election". Leicester City Council. Archived from the original on 13 June 2010. Retrieved 21 May 2010.
- ^ "Leicester City Council - Elections". Archived from the original on 11 May 2013. Retrieved 10 May 2013.
- ^ "Local Elections Archive Project — Castle Ward". www.andrewteale.me.uk. Retrieved 26 August 2022.
- ^ "Eyres Monsell ward by-election". Archived from the original on 11 March 2018.
- ^ "Local Elections Archive Project — Belgrave Ward". www.andrewteale.me.uk. Retrieved 26 August 2022.


