MayaVi
This article has multiple issues. Please help improve it or discuss these issues on the talk page. (Learn how and when to remove these messages)
|
 | |
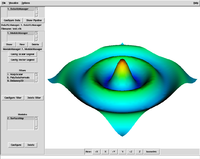
 A screenshot of the main window, with an example visualization | |
| Developer(s) | Enthought |
|---|---|
| Initial release | 2019 |
| Stable release | 4.8.1
/ October 18, 2022[1] |
| Written in | Python, VTK, wxPython/Qt |
| Operating system | Linux, Mac OS X, Microsoft Windows |
| Available in | English |
| Type | Data visualization |
| License | BSD License |
| Website | docs |
MayaVi is a scientific data visualizer written in Python, which uses VTK and provides a GUI via Tkinter. MayaVi was developed by Prabhu Ramachandran, is free and distributed under the BSD License. It is cross-platform and runs on any platform where both Python and VTK are available (almost any Unix, Mac OS X, or Windows). MayaVi is pronounced as a single name, "Ma-ya-vee", meaning "magical" in Sanskrit. The code of MayaVi has nothing in common with that of Autodesk Maya or the Vi text editor.[2]
The latest version of MayaVi, called Mayavi2, is a component of the Enthought suite of scientific Python programs. It differs from the original MayaVi by its strong focus on making an interactive program and a reusable component for 3D plotting in Python. Although it exposes a slightly different interface and API than the original MayaVi, it now has more features.[3][4]
Major features
[edit]- visualizes computational grids and scalar, vector, and tensor data
- an easy-to-use GUI
- can be imported as a Python module from other Python programs or can be scripted from the Python interpreter
- supports volume visualization of data via texture and ray cast mappers
- support for any VTK dataset using the VTK data format
- support for PLOT3D data
- multiple datasets can be used simultaneously
- provides a pipeline browser, with which objects in the VTK pipeline can be browsed and edited
- imports simple VRML and 3D Studio scenes
- custom modules and data filters can be added
- exporting to PostScript files, PPM/BMP/TIFF/JPEG/PNG images, Open Inventor, Geomview OOGL, VRML files, Wavefront .obj files, or RenderMan RIB file
Examples
[edit]Spherical harmonics
[edit]
from numpy import linspace, meshgrid, array, sin, cos, pi, abs
from scipy.special import sph_harm
from mayavi import mlab

theta_1d = linspace(0,   pi,  91)
phi_1d   = linspace(0, 2*pi, 181)

theta_2d, phi_2d = meshgrid(theta_1d, phi_1d)
xyz_2d = array([sin(theta_2d) * sin(phi_2d),
                sin(theta_2d) * cos(phi_2d),
                cos(theta_2d)])
l = 3
m = 0

Y_lm = sph_harm(m, l, phi_2d, theta_2d)
r = abs(Y_lm.real) * xyz_2d

mlab.figure(size=(700, 830))
mlab.mesh(r[0], r[1], r[2], scalars=Y_lm.real, colormap="cool")
mlab.view(azimuth=0, elevation=75, distance=2.4, roll=-50)
mlab.savefig("Y_%i_%i.jpg" % (l, m))
mlab.show()
References
[edit]- ^ "mayavi · PyPI". pypi.org. Retrieved 2023-11-28.
- ^ "MayaVi project page". SourceForge.
- ^ "MayaVi2 wiki page".
- ^ "MayaVi2 project page".
External links
[edit]- mayavi on GitHub
- MayaVi on SourceForge

