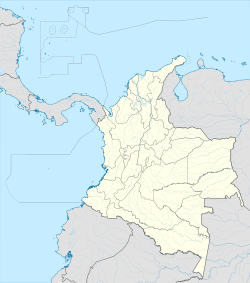
Manzanares, Caldas
Appearance
Manzanares, Caldas | |
|---|---|
Municipality and town | |
 Location of the municipality and town of Manzanares, Caldas in the Caldas Department of Colombia. | |
| Coordinates: 5°15′7″N 75°9′25″W / 5.25194°N 75.15694°W | |
| Country | |
| Department | |
| Elevation | 1,871 m (6,138 ft) |
| Population (Census 2018[1]) | |
| • Total | 16,532 |
| Time zone | UTC-5 (Colombia Standard Time) |
Manzanares (Spanish pronunciation: [mansaˈnaɾes]) is a town and municipality in the Colombian Department of Caldas.
Climate
[edit]Manzanares has a subtropical highland climate (Köppen Cfb). It has warm afternoons, pleasant mornings, and heavy rainfall year-round.
| Climate data for Manzanares (Llanadas), elevation 1,420 m (4,660 ft), (1971–2000) | |||||||||||||
|---|---|---|---|---|---|---|---|---|---|---|---|---|---|
| Month | Jan | Feb | Mar | Apr | May | Jun | Jul | Aug | Sep | Oct | Nov | Dec | Year |
| Mean daily maximum °C (°F) | 24.7 (76.5) |
25.0 (77.0) |
25.1 (77.2) |
25.6 (78.1) |
26.0 (78.8) |
26.4 (79.5) |
26.9 (80.4) |
26.6 (79.9) |
25.9 (78.6) |
25.0 (77.0) |
24.8 (76.6) |
24.5 (76.1) |
25.5 (77.9) |
| Daily mean °C (°F) | 19.4 (66.9) |
19.6 (67.3) |
19.6 (67.3) |
19.9 (67.8) |
20.2 (68.4) |
20.5 (68.9) |
20.4 (68.7) |
20.1 (68.2) |
19.8 (67.6) |
19.4 (66.9) |
19.5 (67.1) |
19.4 (66.9) |
19.8 (67.6) |
| Mean daily minimum °C (°F) | 15.5 (59.9) |
15.6 (60.1) |
15.7 (60.3) |
15.9 (60.6) |
15.9 (60.6) |
15.5 (59.9) |
15.3 (59.5) |
15.2 (59.4) |
15.4 (59.7) |
15.3 (59.5) |
15.4 (59.7) |
15.1 (59.2) |
15.5 (59.9) |
| Average precipitation mm (inches) | 156.4 (6.16) |
197.1 (7.76) |
251.6 (9.91) |
324.7 (12.78) |
316.6 (12.46) |
152.0 (5.98) |
132.1 (5.20) |
171.6 (6.76) |
283.1 (11.15) |
349.9 (13.78) |
279.3 (11.00) |
192.7 (7.59) |
2,807.1 (110.52) |
| Average precipitation days | 17 | 17 | 21 | 22 | 23 | 14 | 12 | 15 | 19 | 24 | 23 | 17 | 225 |
| Average relative humidity (%) | 82 | 82 | 82 | 82 | 80 | 78 | 75 | 75 | 79 | 83 | 82 | 82 | 80 |
| Mean monthly sunshine hours | 124.0 | 107.4 | 105.4 | 108.0 | 130.2 | 132.0 | 167.4 | 158.1 | 141.0 | 117.8 | 111.0 | 111.6 | 1,513.9 |
| Mean daily sunshine hours | 4.0 | 3.8 | 3.4 | 3.6 | 4.2 | 4.4 | 5.4 | 5.1 | 4.7 | 3.8 | 3.7 | 3.6 | 4.1 |
| Source: Instituto de Hidrologia Meteorologia y Estudios Ambientales[2] | |||||||||||||
| Climate data for Manzanares (Agronomia), elevation 2,150 m (7,050 ft), (1971–2000) | |||||||||||||
|---|---|---|---|---|---|---|---|---|---|---|---|---|---|
| Month | Jan | Feb | Mar | Apr | May | Jun | Jul | Aug | Sep | Oct | Nov | Dec | Year |
| Mean daily maximum °C (°F) | 22.2 (72.0) |
22.1 (71.8) |
22.0 (71.6) |
21.4 (70.5) |
21.0 (69.8) |
21.1 (70.0) |
21.6 (70.9) |
21.7 (71.1) |
21.3 (70.3) |
20.7 (69.3) |
21.0 (69.8) |
21.5 (70.7) |
21.5 (70.7) |
| Daily mean °C (°F) | 17.0 (62.6) |
16.9 (62.4) |
17.1 (62.8) |
16.9 (62.4) |
16.7 (62.1) |
16.8 (62.2) |
17.0 (62.6) |
17.0 (62.6) |
16.5 (61.7) |
16.1 (61.0) |
16.3 (61.3) |
16.5 (61.7) |
16.7 (62.1) |
| Mean daily minimum °C (°F) | 12.8 (55.0) |
13 (55) |
13.2 (55.8) |
13.3 (55.9) |
13.3 (55.9) |
13.3 (55.9) |
13.1 (55.6) |
13.2 (55.8) |
12.9 (55.2) |
12.8 (55.0) |
12.8 (55.0) |
12.7 (54.9) |
13 (55) |
| Average precipitation mm (inches) | 121.1 (4.77) |
137.0 (5.39) |
165.5 (6.52) |
191.4 (7.54) |
197.0 (7.76) |
103.9 (4.09) |
73.1 (2.88) |
101.9 (4.01) |
153.0 (6.02) |
251.6 (9.91) |
210.4 (8.28) |
138.2 (5.44) |
1,844.1 (72.60) |
| Average precipitation days | 15 | 15 | 19 | 22 | 23 | 18 | 15 | 17 | 21 | 24 | 21 | 16 | 228 |
| Average relative humidity (%) | 78 | 78 | 78 | 81 | 82 | 79 | 76 | 75 | 79 | 82 | 82 | 80 | 79 |
| Mean monthly sunshine hours | 161.2 | 121.5 | 120.9 | 99.0 | 99.2 | 114.0 | 142.6 | 139.5 | 114.0 | 99.2 | 114.0 | 142.6 | 1,467.7 |
| Mean daily sunshine hours | 5.2 | 4.3 | 3.9 | 3.3 | 3.2 | 3.8 | 4.6 | 4.5 | 3.8 | 3.2 | 3.8 | 4.6 | 4.0 |
| Source: Instituto de Hidrologia Meteorologia y Estudios Ambientales[3] | |||||||||||||
References
[edit]- ^ "Censo Nacional de Población y Vivienda 2018" (in Spanish). DANE. Retrieved 23 April 2020.
- ^ "Promedios Climatológicos 1971–2000" (in Spanish). Instituto de Hidrologia Meteorologia y Estudios Ambientales. Retrieved 25 June 2024.[dead link]
- ^ "Promedios Climatológicos 1971–2000" (in Spanish). Instituto de Hidrologia Meteorologia y Estudios Ambientales. Retrieved 25 June 2024.[dead link]


