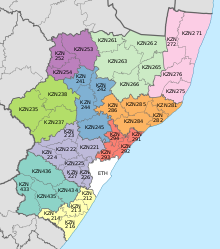
KwaDukuza Local Municipality
This article needs additional citations for verification. (September 2009) |
KwaDukuza | |
|---|---|
 Location of KwaDukuza Local Municipality within KwaZulu-Natal | |
| Coordinates: 29°27′S 31°13′E / 29.450°S 31.217°E | |
| Country | South Africa |
| Province | KwaZulu-Natal |
| District | iLembe |
| Seat | KwaDukuza (Stanger) |
| Wards | 30 |
| Government | |
| • Type | Municipal council |
| • Mayor | Lindi Nhaca (ANC)[1] |
| Area | |
| • Total | 735 km2 (284 sq mi) |
| Population (2022)[2] | |
| • Total | 324,912 |
| • Density | 440/km2 (1,100/sq mi) |
| Racial makeup (2022) | |
| • Black African | 71.4% |
| • Coloured | 1.1% |
| • Indian/Asian | 18.6% |
| • White | 8.6% |
| First languages (2011) | |
| • Zulu | 66.1% |
| • English | 20.8% |
| • Xhosa | 7.0% |
| • Afrikaans | 1.5% |
| • Other | 4.6% |
| Time zone | UTC+2 (SAST) |
| Municipal code | KZN292 |
KwaDukuza Local Municipality is one of four municipalities under iLembe District Municipality, KwaZulu-Natal, South Africa. As of 2022 it has a population of 324,912.
Main places
[edit]The 2001 census divided the municipality into the following main places:[4]
| Place | Code | Area (km2) | Population |
|---|---|---|---|
| Ballito | 54401 | 5.66 | 4,115 |
| Blythedale Beach | 54402 | 0.63 | 466 |
| Darnall | 54403 | 18.19 | 7,413 |
| Mathonsi | 54405 | 11.49 | 4,813 |
| Qwabe (Madundube) | 54406 | 19.54 | 833 |
| Salt Rock | 54407 | 3.03 | 2,326 |
| Shaka's Rock | 54408 | 0.69 | 593 |
| Shakaskraal | 54409 | 2.06 | 4,574 |
| Stanger | 54410 | 77.71 | 98,280 |
| Tinley Manor Beach | 54411 | 0.67 | 473 |
| Zinkwazi Beach | 54412 | 1.36 | 469 |
| Remainder of the municipality | 54404 | 490.62 | 34,210 |
Politics
[edit]The municipal council consists of fifty-nine members elected by mixed-member proportional representation. Thirty councillors are elected by first-past-the-post voting in thirty wards, while the remaining twenty-nine are chosen from party lists so that the total number of party representatives is proportional to the number of votes received. In the election of 1 November 2021 the African National Congress (ANC) lost its majority, obtaining a plurality of twenty-nine seats on the council.
The following table shows the results of the 2021 election.[5]
| Party | Ward | List | Total seats | |||||
|---|---|---|---|---|---|---|---|---|
| Votes | % | Seats | Votes | % | Seats | |||
| African National Congress | 35,754 | 49.57 | 27 | 35,752 | 49.55 | 2 | 29 | |
| Democratic Alliance | 11,054 | 15.32 | 3 | 11,288 | 15.64 | 6 | 9 | |
| ActionSA | 5,516 | 7.65 | 0 | 5,812 | 8.05 | 5 | 5 | |
| Independent Alliance | 5,797 | 8.04 | 0 | 5,084 | 7.05 | 5 | 5 | |
| Economic Freedom Fighters | 4,832 | 6.70 | 0 | 4,938 | 6.84 | 4 | 4 | |
| Inkatha Freedom Party | 4,358 | 6.04 | 0 | 4,836 | 6.70 | 4 | 4 | |
| African Independent Congress | 1,216 | 1.69 | 0 | 1,343 | 1.86 | 1 | 1 | |
| African Transformation Movement | 640 | 0.89 | 0 | 579 | 0.80 | 1 | 1 | |
| African Christian Democratic Party | 476 | 0.66 | 0 | 534 | 0.74 | 1 | 1 | |
| Abantu Batho Congress | 400 | 0.55 | 0 | 405 | 0.56 | 0 | 0 | |
| Independent candidates | 792 | 1.10 | 0 | 0 | ||||
| Al Jama-ah | 322 | 0.45 | 0 | 385 | 0.53 | 0 | 0 | |
| Justice and Employment Party | 299 | 0.41 | 0 | 394 | 0.55 | 0 | 0 | |
| Freedom Front Plus | 221 | 0.31 | 0 | 215 | 0.30 | 0 | 0 | |
| African People's Movement | 207 | 0.29 | 0 | 215 | 0.30 | 0 | 0 | |
| National Freedom Party | 122 | 0.17 | 0 | 175 | 0.24 | 0 | 0 | |
| African Freedom Revolution | 74 | 0.10 | 0 | 115 | 0.16 | 0 | 0 | |
| African People First | 55 | 0.08 | 0 | 84 | 0.12 | 0 | 0 | |
| Total | 72,135 | 100.00 | 30 | 72,154 | 100.00 | 29 | 59 | |
| Valid votes | 72,135 | 97.82 | 72,154 | 97.70 | ||||
| Invalid/blank votes | 1,606 | 2.18 | 1,698 | 2.30 | ||||
| Total votes | 73,741 | 100.00 | 73,852 | 100.00 | ||||
| Registered voters/turnout | 136,781 | 53.91 | 136,781 | 53.99 | ||||
See also
[edit]References
[edit]- ^ Laldas, Jyothi. "Lindi Nhaca elected mayor of KZN's KwaDukuza". Witness. Retrieved 12 February 2022.
- ^ a b "KwaDukuza (Local Municipality, South Africa)". Population Statistics, Charts, Map and Location. 2 February 2022. Retrieved 9 August 2024.
- ^ "Statistics by place". Statistics South Africa. Retrieved 27 September 2015.
- ^ Lookup Tables - Statistics South Africa[permanent dead link]
- ^ "Election Result Table for LGE2021 — KwaDukuza". wikitable.frith.dev. Retrieved 28 November 2021.
External links
[edit]


