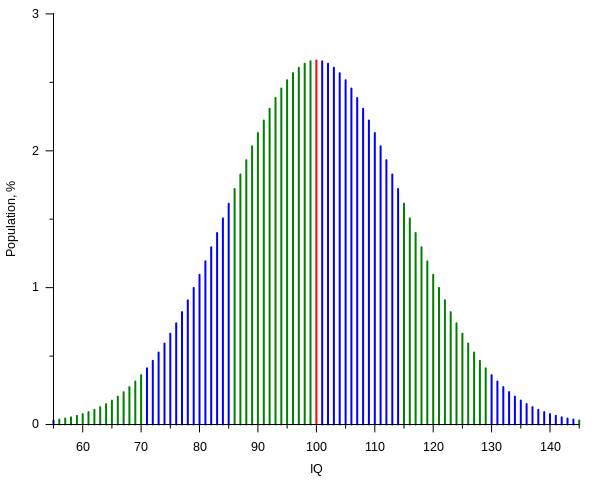
File:IQ curve.svg
Appearance

Size of this PNG preview of this SVG file: 600 × 480 pixels. Other resolutions: 300 × 240 pixels | 960 × 768 pixels | 1,280 × 1,024 pixels | 2,560 × 2,048 pixels.
Original file (SVG file, nominally 600 × 480 pixels, file size: 9 KB)
| This image was selected as picture of the month on the Mathematics Portal for April 2008. |
File history
Click on a date/time to view the file as it appeared at that time.
| Date/Time | Thumbnail | Dimensions | User | Comment | |
|---|---|---|---|---|---|
| current | 23:11, 26 November 2020 |  | 600 × 480 (9 KB) | Paranaja | Reverted to version as of 21:27, 2 November 2012 (UTC) |
| 21:27, 2 November 2012 |  | 600 × 480 (9 KB) | Mikhail Ryazanov | IQ values are now integers; gnuplot-only approach | |
| 09:20, 6 December 2006 |  | 600 × 480 (12 KB) | Alejo2083 | {{Information |Description= The IQ test is made so that most of the people will score 100 and the distribution will have the shape of a Gaussian function, with a standard deviation of 15. The plot shows the percentage of people getting a score versus the |
File usage
More than 100 pages use this file. The following list shows the first 100 pages that use this file only. A full list is available.
- Quantitative psychology
- User:1diot
- User:A435(m)
- User:Aaronsharpe
- User:Albatross2147
- User:Aquarius Rising/userboxes
- User:Astronouth7303
- User:Bbaumer
- User:Btyner
- User:Bukvoed
- User:C4bl3fl4m3
- User:Cedders
- User:ChildOfTheMoon83
- User:ContagiousTruth
- User:Cparker
- User:Cshinsei
- User:Cswrye
- User:Cy21
- User:DarkMark
- User:DaveWF
- User:Deewiant
- User:Demonocracy
- User:Dgw
- User:Dirknachbar
- User:DragonWR12LB
- User:EdK
- User:Eieth
- User:Flammifer/Userboxes
- User:FluteyFlakes88
- User:Fnorth
- User:General Eisenhower/My Monsters
- User:Globaltraveller
- User:Harm.frielink
- User:Harm/Sidebar
- User:Hcblue
- User:Heptadecagram
- User:Hewhocutsdown
- User:Hibernian
- User:Hirak 99
- User:Ikeinthemed
- User:Inkwell
- User:Iothiania
- User:Itsnotvalid
- User:Jaani~enwiki
- User:Jimbow25
- User:John5008
- User:Kazikameuk
- User:Kissson
- User:Klortho
- User:Krzysiu Jarzyna
- User:Kvasir
- User:Loco830/Boxes
- User:Lucinor
- User:Luuknam
- User:M.e
- User:MYT
- User:Mattman723
- User:Michael Hardy
- User:Mukhtar1
- User:NSD Student
- User:NeonMerlin/boxes
- User:Nobu Sho
- User:Octalc0de
- User:Omni ND
- User:OneTopJob6
- User:Orioane
- User:Oryanw~enwiki
- User:Panchitaville
- User:Patrick1982
- User:Pewwer42
- User:Quandaryus
- User:ReaLL Dream
- User:Robinh
- User:Rory77
- User:Saurabhb
- User:ScaldingHotSoup
- User:Scepia/standard deviation
- User:Sfaok
- User:ShakataGaNai/ubx
- User:Sharpestmarble
- User:SheahanF
- User:Somewherepurple
- User:Sonny jim
- User:Sorca1701
- User:Sparkleyone
- User:Spellcheck
- User:Tbbooher~enwiki
- User:Tomyumgoong
- User:Tsm1128
- User:Tulkas~enwiki
- User:UBX/statistical reasons
- User:VectorCell
- User:Wezzo/userboxtemplates
- User:Wic2020
- User:Wschwarz
- User:Wschwarz/Col2
- User:Zemyla
- User talk:BlaiseFEgan
- Wikipedia:Userboxes/Mathematics
- Wikipedia:Userboxes/Userboxes
View more links to this file.
Global file usage
The following other wikis use this file:
- Usage on ar.wikipedia.org
- Usage on ast.wikipedia.org
- Usage on az.wikipedia.org
- Usage on ba.wikipedia.org
- Usage on be-tarask.wikipedia.org
- Usage on be.wikipedia.org
- Usage on ca.wikipedia.org
- Usage on cs.wikipedia.org
- Usage on da.wikipedia.org
- Usage on de.wikipedia.org
- Intelligenzquotient
- Normwert
- Wikipedia:WikiProjekt Psychologie/Archiv
- Benutzer:SonniWP/Hochbegabung
- Kritik am Intelligenzbegriff
- The Bell Curve
- Benutzer:Rainbowfish/Bilder
- Quantitative Psychologie
- Intelligenzprofil
- Benutzer:LauM Architektur/Babel
- Benutzer:LauM Architektur/Babel/Überdurchschnittlicher IQ
- Usage on de.wikibooks.org
- Elementarwissen medizinische Psychologie und medizinische Soziologie: Theoretisch-psychologische Grundlagen
- Elementarwissen medizinische Psychologie und medizinische Soziologie/ Druckversion
- Elementarwissen medizinische Psychologie und medizinische Soziologie/ Test
- Benutzer:OnkelDagobert:Wikilinks:Psychologie
- Usage on de.wikiversity.org
- Usage on en.wikinews.org
- Usage on en.wikiversity.org
- Usage on eo.wikipedia.org
- Usage on es.wikipedia.org
- Usage on es.wikinews.org
- Usage on eu.wikipedia.org
- Usage on fa.wikipedia.org
- Usage on fi.wikipedia.org
- Usage on fr.wikipedia.org
- Usage on gl.wikipedia.org
- Usage on he.wikipedia.org
View more global usage of this file.

