Jump to content

File:Humanevolutionchart.png

Page contents not supported in other languages.
This is a file from the Wikimedia Commons
From Wikipedia, the free encyclopedia

Original file (1,833 × 2,052 pixels, file size: 868 KB, MIME type: image/png)

Summary

Description

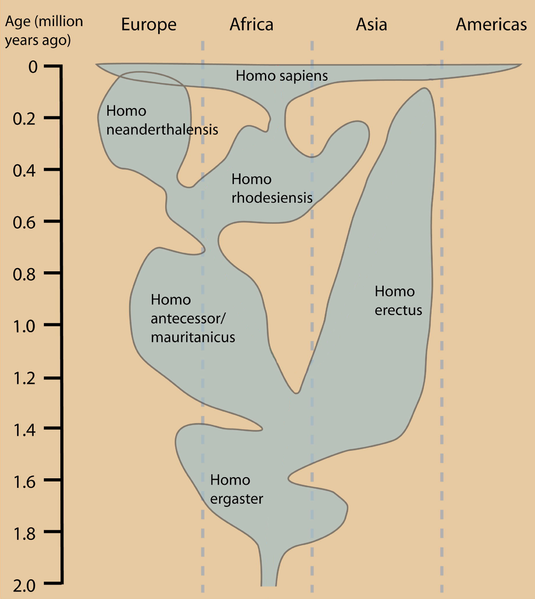
Temporal and Geographical Distribution of Hominid Populations Redrawn from Stringer (2003)

"This figure depicts one view of human evolutionary history based on fossil data. Other interpretations differ primarily in the taxonomy and geographical distribution of hominid species. The temporal distribution of the two divergent lineages of P. humanus is superimposed on the hominid tree to show host evolutionary events that were contemporaneous with the origin of P. humanus. Whereas the NW lineage is depicted on H. erectus in this figure, several alternative hypotheses are consistent with our data when other evolutionary histories of hominids are considered (unpublished data). The WW clade is shown in red and the NW clade in blue (see text for descriptions of clades)."
Date
Source From: Genetic Analysis of Lice Supports Direct Contact between Modern and Archaic Humans Reed DL, Smith VS, Hammond SL, Rogers AR, Clayton DH PLoS Biology Vol. 2, No. 11, e340 doi:10.1371/journal.pbio.0020340
Author Reed DL, Smith VS, Hammond SL, Rogers AR, Clayton DH
Permission
(Reusing this file)
w:en:Creative Commons
attribution
This file is licensed under the Creative Commons Attribution 2.5 Generic license.
You are free:
  • to share – to copy, distribute and transmit the work
  • to remix – to adapt the work
Under the following conditions:
  • attribution – You must give appropriate credit, provide a link to the license, and indicate if changes were made. You may do so in any reasonable manner, but not in any way that suggests the licensor endorses you or your use.
PLOS
PLOS
This file was published in a Public Library of Science journal. Their website states that the content of all PLOS journals is published under the Creative Commons Attribution 4.0 license (or its previous version depending on the publication date), unless indicated otherwise.
Other versions Image:Humanevolutionchart_sv.png, Image:Humanevolutionchart.jpg, Image:Evoumanait.png

Captions

Add a one-line explanation of what this file represents

Items portrayed in this file

depicts

5 October 2004

File history

Click on a date/time to view the file as it appeared at that time.

Date/TimeThumbnailDimensionsUserComment
current20:15, 15 August 2007Thumbnail for version as of 20:15, 15 August 20071,833 × 2,052 (868 KB)TimVickers{{Information |Description=Temporal and Geographical Distribution of Hominid Populations Redrawn from Stringer (2003) "This figure depicts one view of human evolutionary history based on fossil data. Other interpretations differ primarily in the taxonomy

Global file usage

Metadata