From Wikipedia, the free encyclopedia
 President George W. Bush
This is the electoral history of George W. Bush, who served as the 43rd president of the United States (2001–2009) and as the 46th governor of Texas (1995–2000).
1978 congressional election
[edit]1994 Texas gubernatorial election
[edit]1998 Texas gubernatorial election
[edit]2000 United States presidential election
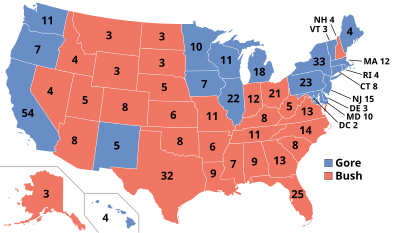
[edit] Electoral college map of the 2000 United States presidential election
Electoral results
| Presidential candidate
|
Party
|
Home state
|
Popular vote
|
Electoral
vote
|
Running mate
|
| Count
|
Percentage
|
Vice-presidential candidate
|
Home state
|
Electoral vote
|
| George W. Bush
|
Republican
|
Texas
|
50,456,002
|
47.87%
|
271
|
Dick Cheney
|
Wyoming
|
271
|
| Al Gore
|
Democratic
|
Tennessee
|
50,999,897
|
48.38%
|
266
|
Joe Lieberman
|
Connecticut
|
266
|
| Ralph Nader
|
Green
|
Connecticut
|
2,882,955
|
2.74%
|
0
|
Winona LaDuke
|
Minnesota
|
0
|
| Pat Buchanan
|
Reform
|
Virginia
|
448,895
|
0.43%
|
0
|
Ezola B. Foster
|
California
|
0
|
| Harry Browne
|
Libertarian
|
Tennessee
|
384,431
|
0.36%
|
0
|
Art Olivier
|
California
|
0
|
| Howard Phillips
|
Constitution
|
Virginia
|
98,020
|
0.09%
|
0
|
Curtis Frazier
|
Missouri
|
0
|
| John Hagelin
|
Natural Law
|
Iowa
|
83,714
|
0.08%
|
0
|
Nat Goldhaber
|
California
|
0
|
| Other
|
51,186
|
0.05%
|
—
|
Other
|
—
|
| (abstention)[a]
|
—
|
—
|
—
|
—
|
1
|
(abstention)[a]
|
—
|
1
|
| Total
|
105,421,423
|
100%
|
538
|
|
538
|
| Needed to win
|
270
|
|
270
|
- Source: "2000 Presidential Electoral and Popular Vote" (Excel 4.0). Federal Election Commission.
Republican presidential primaries (2000)
[edit] First-instance vote by state
 | George W. Bush (43) John McCain (7) |
2000 Republican Party presidential primaries[9]
| Candidate
|
Votes
|
%
|
| George W. Bush
|
12,034,676
|
62.00%
|
| John McCain
|
6,061,332
|
31.23%
|
| Alan Keyes
|
985,819
|
5.08%
|
| Steve Forbes
|
171,860
|
0.89%
|
| Unpledged
|
61,246
|
0.32%
|
| Gary Bauer
|
60,709
|
0.31%
|
| Orrin Hatch
|
15,958
|
0.08%
|
| Al Gore (write-in)
|
1,155
|
0.01%
|
| Bill Bradley (write-in)
|
1,025
|
0.01%
|
| Total votes
|
19,393,780
|
100.00%
|
2004 United States presidential election
[edit] Electoral college map of the 2004 United States presidential election
Electoral results
| Presidential candidate
|
Party
|
Home state
|
Popular vote
|
Electoral
vote
|
Running mate
|
| Count
|
Percentage
|
Vice-presidential candidate
|
Home state
|
Electoral vote
|
| George Walker Bush
|
Republican
|
Texas
|
62,040,610
|
50.73%
|
286
|
Richard Bruce Cheney
|
Wyoming
|
286
|
| John Forbes Kerry
|
Democratic
|
Massachusetts
|
59,028,444
|
48.27%
|
251
|
John Reid Edwards
|
North Carolina
|
251
|
| John Edwards[b]
|
Democratic
|
North Carolina
|
|
|
1
|
John Reid Edwards
|
North Carolina
|
1
|
| Ralph Nader
|
Independent
|
Connecticut
|
465,650
|
0.38%
|
0
|
Peter Camejo
|
California
|
0
|
| Michael Badnarik
|
Libertarian
|
Texas
|
397,265
|
0.32%
|
0
|
Richard Campagna
|
Iowa
|
0
|
| Michael Peroutka
|
Constitution
|
Maryland
|
143,630
|
0.12%
|
0
|
Chuck Baldwin
|
Florida
|
0
|
| David Cobb
|
Green
|
Texas
|
119,859
|
0.10%
|
0
|
Pat LaMarche
|
Maine
|
0
|
| Leonard Peltier
|
Peace and Freedom
|
Pennsylvania
|
27,607
|
0.02%
|
0
|
Janice Jordan
|
California
|
0
|
| Walt Brown
|
Socialist
|
Oregon
|
10,837
|
0.01%
|
0
|
Mary Alice Herbert
|
Vermont
|
0
|
| Róger Calero[c]
|
Socialist Workers
|
New York
|
3,689
|
0.01%
|
0
|
Arrin Hawkins[c]
|
Minnesota
|
0
|
| Thomas Harens
|
Christian Freedom
|
Minnesota
|
2,387
|
0.002%
|
0
|
Jennifer Ryan
|
Minnesota
|
0
|
| Other
|
50,652
|
0.04%
|
—
|
Other
|
—
|
| Total
|
122,295,345
|
100%
|
538
|
|
538
|
| Needed to win
|
270
|
|
270
|
Source (Electoral and Popular Vote): Federal Elections Commission Electoral and Popular Vote Summary
- ^ "TX District 19 – R Primary – May 6, 1978". Our Campaigns.
- ^ "TX District 19 – R Runoff – June 3, 1978". Our Campaigns.
- ^ "TX District 19 – November 7, 1978". Our Campaigns.
- ^ "TX Governor – R Primary Race – Mar 08, 1994". Our Campaigns.
- ^ Our Campaigns – TX Governor Race – Nov 08, 1994
- ^ Our Campaigns – TX Governor – R Primary Race – Mar 10, 1998
- ^ Our Campaigns – TX Governor Race – Nov 03, 1998
- ^ Dizikes, Peter (January 6, 2006). "Electoral College Puts Bush Over the Top - ABC News". Abcnews.go.com. Archived from the original on March 5, 2016. Retrieved August 18, 2016.
- ^ Our Campaigns – US President – R Primaries Race – Feb 01, 2000
- ^ "MPR: Minnesota elector gives Edwards a vote; Kerry gets other nine". News.minnesota.publicradio.org. Retrieved May 5, 2009.


