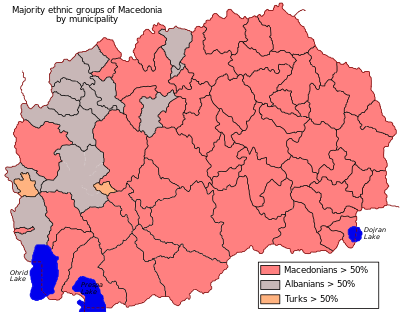
Demographic history of North Macedonia
Appearance
This article includes a list of general references, but it lacks sufficient corresponding inline citations. (December 2010) |
This article presents the Demographic history of North Macedonia through census results since 1948.
1948 census
[edit]- TOTAL = 1,152,986
- Macedonians = 789,603 (68.5%)
- Albanians = 197,603 (17.1%)
- Turks = 95,940 (8.3%)
- Serbs = 29,721 (2.6%)
- Romani = 19,500 (1.7%)
- Aromanians = 9,511 (0.8%)
- Montenegrins = 2,348 (0.2%)
- Croats = 2,090
- Muslims = 1,560
- Others = 5,324 (0.46%)
1953 census
[edit]- TOTAL = 1,394,514
- Macedonians = 860,699 (66%)
- Albanians = 162,000 (12.4%)
- Turks = 203,928 (15.6%)
- Romani = 20,462 (1.6%)
- Serbs = 35,112 (2.7%)
- Croats = 2,771
- Montenegrins = 2,526 (0.18%)
- Muslims = 1,591
- Others = 56,981 (1.07%)
1961 census
[edit]- TOTAL = 1,406,003
- Macedonians = 900,685 (71.2%)
- Albanians = 183,108 (13%)
- Turks = 131,481 (9.4%)
- Serbs = 42,728 (2.7%)
- Romani = 20,606 (1.5%)
- Croats = 3,801
- Montenegrins = 3,414 (0.24%)
- Yugoslavs = 1,260
- Muslims = 3,002
- Slovenes = 1,147
- Others = 90,549 (1.03%)
1971 census
[edit]- TOTAL = 1,647,308
- Macedonians = 1,142,375 (69.3%)
- Albanians = 279,871 (17%)
- Turks = 108,552 (6.6%)
- Romani = 24,505 (1.5%)
- Yugoslavs = 3,652 (0.24%)
- Serbs = 46,465 (2.85%)
- Aromanians = 7,000 (0.42%)
- Croats = 3,882
- Montenegrins = 3,246 (0.19%)
- Muslims = 1,248
- Others = 34,005 (1.55%)
1981 census
[edit]
- TOTAL = 1,909,146
- Macedonians = 1,279,323 (67%)
- Albanians = 377,208 (19.8%)
- Turks = 86,591 (4.5%)
- Romani = 43,125 (2.3%)
- Aromanians = 6,384 (0.3%)
- Serbs = 44,613 (2.3%)
- Muslims = 39,555 (2.2%)
- Yugoslavs = 14,240
- Croats = 3,349
- Montenegrins = 3,940 (0.21%)
- Others = 10,818 (0.56%)
1991 census
[edit]- TOTAL = 2,033,964
- Macedonians = 1,328,187 (65.3%)
- Albanians = 441,987 (21.73%)
- Turks = 77,080 (3.79%)
- Romani = 52,103 (2.56%)
- Aromanians = 7,764 (0.38%)
- Serbs = 42,755 (2.1%)
- Muslims = 31,356 (1.54%)
- Greeks = 474 (0.02%)
- Bulgarians = 1,370 (0.07%)
- Others = 50,888 (2.6%)
1994 census
[edit]- TOTAL = 1,936,877
- Macedonians = 1,288,330 (66.5%)
- Albanians = 441,104 (22.86%)
- Turks = 77,252 (4%)
- Romani = 43,732 (2.25%)
- Aromanians = 8,467(0.44%)
- Serbs = 39,620 (2.04%)
- Others = 34,960 (1.8%)
2002 census
[edit]
- TOTAL = 2,022,547
- Macedonians: 1,297,981 (64.17%)
- Albanians: 509,083 (25.17%)
- Turks: 77,959 (3.85%)
- Romani: 53,879 (2.66%)
- Serbs: 35,939 (1.78%)
- Bosniaks 17,018 (0.84%)
- Aromanians: 9,695 (0.479%)
- Egyptians: 3,713 (0.184%)
- Croats: 2,686 (0.133%)
- Muslims: 2,553 (0.13%)
- Montenegrins: 2,003 (0.1%)
- Bulgarians: 1,418 (0.073%)
- Greeks: 422 (0.021%)
- Russians: 368 (0.018%)
- Slovenes: 365
- Poles: 162
- Ukrainians: 136
- Hungarians: 129
- Germans: 88
- Czechs: 60
- Slovaks: 60
- Jews: 53
- Italians: 46
- Austrians: 35
- Rusyns: 24
- Regionally affiliated: 829
- Non-declared: 404
- Others: 5,332 (0.264%)
2021 census
[edit]| Ethnicity[1] | Number | % |
|---|---|---|
| Total | 1836713 | 100 |
| Macedonians | 1073299 | 58.44 |
| Albanians | 446245 | 24.30 |
| Turks | 70961 | 3.86 |
| Romani | 46433 | 2.53 |
| Serbs | 23847 | 1.30 |
| Bosniaks | 16042 | 0.87 |
| Aromanians | 8714 | 0.47 |
| Torbesh | 4174 | 0.23 |
| Bulgarians | 3504 | 0.19 |
| Egyptians | 2406 | 0.13 |
| Croats | 2145 | 0.12 |
| Muslims | 1187 | 0.06 |
| Montenegrins | 1023 | 0.06 |
| Macedonian Muslims | 455 | 0.02 |
| Unknown | 472 | 0.03 |
| Others | 2987 | 0.16 |
| Non-declared | 450 | 0.02 |
| Regionally affiliated | 110 | 0.01 |
| Persons for whom data were obtained from administrative sources | 132 260 | 7.20 |
See also
[edit]References
[edit]- ^ "Census of Population, Households and Dwellings in the Republic of North Macedonia, 2021 - first dataset" (PDF). State Statistical Office. 30 March 2022. Retrieved 30 March 2022.
- Nasevski, Boško; Angelova, Dora. Gerovska, Dragica (1995). Македонски Иселенички Алманах '95. Skopje: Матица на Иселениците на Македонија.
- Statistical Yearbook of the Republic of Macedonia 2004 (CD version)
- 2002 Macedonian Census


