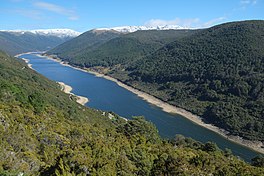
Cobb Reservoir
| Cobb Reservoir | |
|---|---|
 Cobb Reservoir in autumn | |
| Location | New Zealand |
| Coordinates | 41°07′16″S 172°39′28″E / 41.121014°S 172.657796°E |
| Type | reservoir |
| Primary inflows | Cobb River |
| Primary outflows | Cobb River |
| Built | 1949–1954 |
| Max. length | 6 kilometres (3.7 mi) |
| Max. width | 450 metres (1,476 ft) |
| Water volume | 25,600,000 m3 (900,000,000 cu ft) when full[1] |
| Surface elevation | 819 metres (2,687 ft)[2] |
| Location | |
 | |
The Cobb Reservoir is a hydro storage lake fed by the Cobb River in the Tasman District of the South Island of New Zealand. The reservoir feeds the Cobb Power Station and is 819 metres (2,687 ft) above sea level but drops significantly with low rainfall.[3] Cobb Reservoir is the highest hydro storage lake in New Zealand, and is entirely surrounded by Kahurangi National Park.[4] The reservoir, dam, penstock and powerhouse are excluded from the national park.[5]
The dam that forms the reservoir was built from 1949 to 1954, replacing a smaller structure built about ten years earlier. It is an earth dam 32 metres (105 ft) high by 221 metres (725 ft) long. The geology of the area precluded the construction of a concrete dam.[6]
A narrow winding road leads over Cobb Ridge to Cobb Reservoir and along the lake's shore, providing access to tramping tracks in the area surrounding the valley. The road was built in the 1940s and remains unsealed from Cobb Power Station onwards.[1] The access road to the reservoir is the only road into the interior of Kahurangi National Park.[7]
Climate
[edit]| Climate data for Cobb Dam, elevation 823 m (2,700 ft), (1991–2020) | |||||||||||||
|---|---|---|---|---|---|---|---|---|---|---|---|---|---|
| Month | Jan | Feb | Mar | Apr | May | Jun | Jul | Aug | Sep | Oct | Nov | Dec | Year |
| Mean daily maximum °C (°F) | 18.4 (65.1) |
18.4 (65.1) |
16.8 (62.2) |
13.9 (57.0) |
11.5 (52.7) |
8.6 (47.5) |
8.0 (46.4) |
8.8 (47.8) |
10.2 (50.4) |
12.5 (54.5) |
14.4 (57.9) |
16.2 (61.2) |
13.1 (55.7) |
| Daily mean °C (°F) | 13.3 (55.9) |
13.5 (56.3) |
11.8 (53.2) |
9.2 (48.6) |
6.9 (44.4) |
4.3 (39.7) |
3.5 (38.3) |
4.3 (39.7) |
6.0 (42.8) |
8.0 (46.4) |
9.7 (49.5) |
11.6 (52.9) |
8.5 (47.3) |
| Mean daily minimum °C (°F) | 8.2 (46.8) |
8.5 (47.3) |
6.8 (44.2) |
4.5 (40.1) |
2.3 (36.1) |
0.0 (32.0) |
−1.0 (30.2) |
−0.3 (31.5) |
1.7 (35.1) |
3.4 (38.1) |
5.0 (41.0) |
7.0 (44.6) |
3.8 (38.9) |
| Average rainfall mm (inches) | 118.1 (4.65) |
109.6 (4.31) |
175.7 (6.92) |
206.5 (8.13) |
213.9 (8.42) |
198.3 (7.81) |
227.6 (8.96) |
223.3 (8.79) |
197.7 (7.78) |
217.7 (8.57) |
162.0 (6.38) |
180.2 (7.09) |
2,230.6 (87.81) |
| Source: NIWA[8] | |||||||||||||
See also
[edit]References
[edit]- ^ a b "Cobb Valley". Department of Conservation NZ. Retrieved 3 December 2015.
- ^ "Cobb Reservoir, Tasman - NZ Topo Map". NZ Topo Map. Land Information New Zealand. Retrieved 3 December 2015.
- ^ Fairfax NZ News (8 April 2008). "Cobb Reservoir level dangerously low". The Nelson Mail. Retrieved 24 February 2013.
- ^ "Cobb Dam". Engineering New Zealand Te Ao Rangahau. Retrieved 17 October 2024.
- ^ "Top of the South Maps". Nelson City Council and Tasman District Council. Retrieved 24 April 2024.
- ^ Martin, John E. (1999). People, politics, and power stations: electric power generation in New Zealand, 1880–1998. Electricity Corp. of New Zealand and Historical Branch, Dept. of Internal Affairs. ISBN 9780908912988.
- ^ Hindmarsh, Gerard (1 June 2019). "Cobb scheme still a powerhouse after 75 years". Stuff. Retrieved 10 February 2024.
- ^ "CliFlo – National Climate Database : Cobb Dam". NIWA. Retrieved 19 May 2024.
