Charles Ibry
Charles (Stéphane Ernest) Ybry | |
|---|---|
| Born | 1819 Paris |
| Died | 10 April 1883 Neuilly |
| Occupation | Engineer |
| Engineering career | |
| Discipline | Railway engineer |
Charles Ibry was a French railway engineer who invented a timetable chart in the 1840s for planning train schedules for efficiency and safety on the Paris to Le Havre line.[1]
Life and politics
[edit]He was married to Clotilde Delbar, great-grandparents of Emmanuelle de Dampierre. From 1860 to 1870, he was councilmember and from 1868 to 1870 mayor in Neuilly.[2] In 1882, a villa was constructed for him in Dinard.[3]
Ibry chart
[edit]
In the first half of the 1800s, the early days of train operation, little thought was given to punctuality and train safety, and many accidents occurred, often deadly. Also, extending the lax schedule of stagecoach timetabling, trains were often late or early, complicating the task of keeping trains apart on the same section of track.[1]
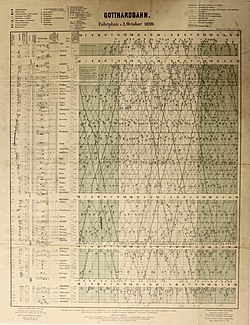
Ibry developed a time–distance diagram and ruler to determine train plans and keep trains apart. It shows distance (with train stations) on the vertical axis, and time of day on the horizontal axis. Each train is given a diagonal line going from start to destination. If two lines intersect, it means two trains are at the same position at the same time, and one or both must be rescheduled[1][4][5] — in some cases trains are paused at stations or sidings. Ibry's chart influenced rail planning ever since, starting in France.[6][1] It is also known as a line grid or string chart.
References
[edit]- ^ a b c d Fry, Hannah (14 June 2021). "When Graphs Are a Matter of Life and Death". The New Yorker.
Within a decade, the graphs were beings used to create train schedules across the world
- ^ "YBRY Charles (1819-1883)". Cimetière du Père Lachaise. Père Lachaise Cemetery. 22 August 2022.
- ^ Lenglet, Marie (5 March 2021). "Dinard. À Saint-Enogat, la villa Les Marettes est à vendre". Ouest-France.fr (in French).
- ^ Marey, Etienne-Jules (1885). "La méthode graphique dans les sciences expérimentales et principalement en physiologie et en médicine". Paris : G. Masson. p. 51.
- ^ Tufte, Edward R. (2018). The visual display of quantitative information (Second, tenth printing, April 2018 ed.). Cheshire, Conn: Graphics Press. ISBN 0-9613921-4-2.
- ^ "Annales des ponts et chaussées. Mémoires et documents relatifs à l'art des constructions et au service de l'ingénieur". Gallica. France Conseil général des ponts et chaussées Auteur du. 1847.
